The Graph (GRT) Price Analysis: Bearish Pressure Persists Near $0.0247 as Long-Term Forecasts Project $0.1556 by 2032
Key Takeaways
- •GRT trades at $0.024745 as of October 17, 2026, roughly 99% below its $2.88 all-time high from February 2021 and below the $0.03 price of its October 2020 public sale.
- •Daily technical indicators signal persistent bearish momentum, with the RSI at 46.27 and immediate support at $0.02440 against resistance near $0.02520.
- •Long-term forecasts project GRT averaging $0.0327 in 2026, $0.0591 in 2028, and about $0.1297 by 2032, with a potential peak of $0.1556.
- •Analysts consider it unlikely GRT will reach $1 by 2032, since that would require a gain of more than 40 times the current price.
- •The Graph network runs more than 100 indexer nodes, has processed roughly 1.23 trillion queries, and supports over 70,000 projects.
Key takeaways
- The Graph could climb toward $0.0386 in 2026 if bullish momentum strengthens.
- GRT may average $0.0591 in 2028, with forecasts ranging from $0.0514 to $0.0668.
- By 2032, GRT could reach $0.1556, with an average of around $0.1297.
The Graph at a glance
The Graph gives developers and users a decentralized way to access and organize blockchain data efficiently. The protocol operates continuously and maintains a reported uptime of 99.99%.
Subgraphs form a key part of The Graph ecosystem. These open APIs help applications index, structure, and retrieve blockchain data across supported networks. The network includes more than 100 indexer nodes, has handled approximately 1.23 trillion queries, and supports over 70,000 projects across its ecosystem. Together, these figures indicate the scale of activity on the network and provide background for the token analysis that follows.
GRT serves as the native token powering The Graph network. Participants earn GRT for indexing blockchain information and helping users access reliable decentralized data. The analysis below examines potential price targets, long-term forecasts, and the major factors that could influence GRT's performance.
The Graph price prediction: Technical analysis
The Graph (GRT) trades at $0.024745 as bearish pressure persists. The token faces critical support at $0.02440 and resistance near $0.02520. Short-term recovery attempts are emerging despite continued selling pressure and weakness. For context, the current level sits below the $0.03 at which GRT sold in its October 2020 public sale and roughly 99% below the $2.88 all-time high recorded in February 2021.
On 17 October 2026, the GRT price trades at $0.024745, declining 1.35% over the past 24 hours. The token faces immediate support at $0.02440, while resistance stands near $0.02520.
The Graph 1-day chart analysis
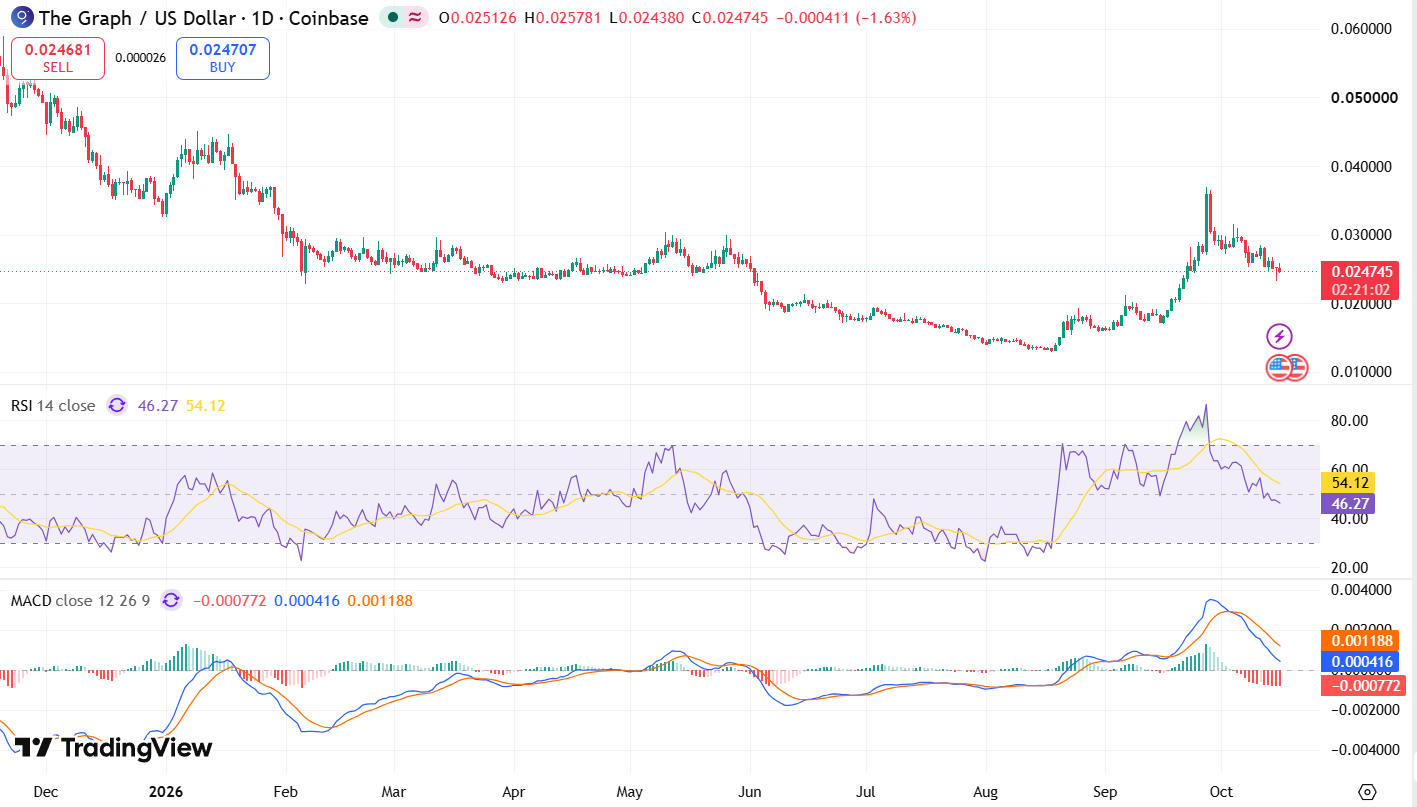
Daily price action shows continued bearish pressure as the token struggles to maintain its recent recovery. After a strong rally in late September, GRT faces renewed selling pressure and has formed lower highs. The token currently trades at $0.024745, reflecting weakening upward momentum as prices approach an important support zone.
The Relative Strength Index (RSI) stands at 46.27, below the neutral 50 level, indicating weakening buying strength. Meanwhile, the MACD remains positive at 0.000416 but trades below its signal line at 0.001188. The negative histogram reading of -0.000772 confirms bearish momentum, supporting the downward price movement visible on the daily chart.
The Graph 4-hour chart analysis
The 4-hour chart also reflects continued bearish pressure as the token struggles to sustain its recovery. Repeated attempts to overcome resistance have failed, producing lower highs and renewed selling activity. However, recent price movements suggest a possible stabilization as the token attempts to recover from its latest decline.\nThe RSI stands at 42.62, below the neutral 50 level, indicating weak buying momentum without reaching oversold territory. Meanwhile, the MACD remains negative at -0.000393 but trades above its signal line at -0.000458. The positive histogram reading of 0.000065 suggests easing bearish momentum, pointing to a potential short-term recovery despite the broader downward pressure.
What can we expect next in GRT price analysis?
The GRT price outlook remains bearish as the token struggles to regain upward momentum. If selling pressure continues, GRT could retest immediate support at $0.02440, with a breakdown exposing further downside risks. Holding above this level, however, could encourage renewed buying activity and support a short-term recovery.
On the upside, GRT must overcome resistance at $0.02520 to strengthen its recovery prospects. A sustained breakout could open the way toward $0.02550 and $0.02577. While the daily trend remains weak, improving short-term momentum suggests a possible rebound if buying interest strengthens. Beyond these chart levels, GRT's trading history shows its monthly performance has often tracked broader cryptocurrency market sentiment, making overall market conditions another factor to watch alongside the token's own price action.
Why is GRT down?
GRT faces downward pressure as weakening buying momentum and repeated resistance rejections limit recovery attempts. The token has struggled to maintain gains following its late September rally, leading to lower highs and continued selling activity. The daily technical outlook remains bearish, suggesting market participants remain cautious about a sustained recovery.
Meanwhile, GRT's failure to reclaim resistance at $0.02520 adds pressure to its short-term outlook. The token remains vulnerable to further declines toward $0.02440 if demand weakens. Although short-term momentum shows signs of stabilization, stronger buying activity is needed to reverse the prevailing downward trend.
Is The Graph a good investment?
The Graph offers a decentralized alternative to some Web2 data services through its scalable and cost-efficient infrastructure. Its subgraphs serve a role similar to the APIs behind many Web2 applications, except that a distributed network of indexers maintains the data layer rather than a single provider. However, GRT remains vulnerable to broader crypto market volatility and changing investor sentiment.
Market sentiment currently leans bearish, although longer-term projections indicate potential recovery and growth. Investors should research carefully and consider market risks before investing in GRT.
Will GRT reach $0.1?
GRT could average around $0.1189 in 2031 as The Graph ecosystem continues expanding. The token may trade between $0.1037 and $0.1456 throughout the year, depending on broader market conditions, levels that sit roughly four to six times above the current price of $0.024745. The crypto market remains highly volatile, making independent research and careful risk assessment important before investing.
Will GRT reach $1?
Based on current long-term GRT price forecasts, The Graph is unlikely to reach $1 by 2032. Reaching that level would require a gain of more than 40 times from the current price of $0.024745.
Does GRT have a good long-term future?
Market forecasts indicate GRT could gain value over the coming years. However, major crypto sell-offs or stricter regulations could pressure its growth prospects. Investors should research carefully and consider professional financial advice before investing in the highly volatile cryptocurrency market.
The Graph price prediction for October 2026
The Graph must break above key resistance levels to improve its bearish outlook this month. GRT may trade between $0.0228 and $0.0286, with an average price near $0.0257, a range that brackets the levels where the token has traded since slipping from approximately $0.0292 at the start of October. A sustained move above resistance could strengthen recovery prospects, while continued weakness may keep the token under pressure.
GRT price prediction 2026
GRT could regain earlier price levels during the third quarter of 2026. Forecasts place the token between $0.0251 and $0.0386, with an average price of $0.0327.
GRT price predictions 2027–2032
The Graph price prediction for 2027
The Graph could trade as low as $0.0295 in 2027, according to projected price estimates. GRT may reach a yearly high of $0.0391, while its average price could remain near $0.0343. Market conditions and broader crypto trends may influence the token's performance throughout the year.
The Graph price prediction for 2028
The Graph could fall to a minimum price of $0.0514 in 2028 based on current projections. GRT may climb as high as $0.0668 during the year, while the average forecast price is estimated at around $0.0591. Broader market conditions and investor sentiment could influence how closely the token follows this outlook.
The Graph price prediction for 2029
The Graph could trade at a minimum price of $0.0702 in 2029 based on current projections. GRT may rise to a maximum of $0.0936 during the year, while its average price is expected to remain near $0.0835. Market momentum and broader cryptocurrency conditions could influence the token's performance throughout 2029.
The Graph price prediction for 2030
The Graph could trade as low as $0.0766 in 2030 based on projected price estimates. GRT may reach a maximum of $0.0969 during the year, while its average trading price could settle near $0.0851. Broader crypto market conditions may influence the token's performance throughout 2030.
The Graph price prediction for 2031
The Graph could trade at a minimum price of $0.1037 in 2031 based on current projections. GRT may climb as high as $0.1456 during the year, while its average trading price could remain near $0.1189. Market sentiment and broader cryptocurrency trends may influence the token's performance throughout 2031.
The Graph price prediction for 2032
The Graph could fall to a minimum price of $0.1121 in 2032 based historical price trends and technical projections. GRT may reach a yearly high of $0.1556, while its average trading price could remain near $0.1297. Broader market conditions and long-term demand may influence how closely the token follows this forecast.
Cryptopolitan's GRT price forecast
GRT could climb as high as $0.0386 during the second half of 2026. In 2027, forecasts place the token between $0.0295 and $0.0391, averaging around $0.0343. By 2032, The Graph may trade between $0.1121 and $0.1556, with an estimated average of $0.1297. These forecasts are not investment advice, and investors should research independently or consult a qualified financial professional.
The Graph's historic price sentiment
Yaniv Tal, Brandon Ramirez, and Jennus Pohlman launched The Graph on the Ethereum blockchain in 2018.
In June 2020, The Graph held its private token sale, raising $5 million. Participants included Multicoin Capital, Digital Currency Group, and DTC Capital. The public sale, which took place in October 2020, raised $12 million, with each token sold for $0.03. The mainnet launched in December 2020. In January 2021, another sale led by Tiger Global Management raised $50 million.
GRT delivered its best performance in 2021, registering its all-time high at $2.88 on February 12, 2021, according to crypto market data. In February 2022, venture capital firms DCG, Multicoin Capital, NGC Ventures, Gumi Cryptos Capital, and Hashkey announced the launch of a $205 million ecosystem fund for The Graph Protocol.
In the years that followed, GRT consistently traded below $0.7, and according to historical data it fell below $0.2 in 2023.
In 2024, GRT reached a high of $0.45 in March before falling below $0.20 in July and dipping to $0.1280 in August, with a brief spike to $0.1767. After a gradual decline, it closed at $0.1470 by October. A recovery followed, with GRT climbing to $0.281 in November and peaking at $0.337 in December before ending the year at $0.198.
At the start of January 2025, GRT was trading at $0.23, a level that decreased to $0.13 in February. In March, the price declined and touched lows below $0.09. By the end of April, GRT had recovered toward the crucial $0.1 mark, and in the first half of May it touched $0.127 while surging to $0.132 during a bullish stretch of market sentiment. In June, GRT touched its lowest point of $0.0695, and in July 2025 it saw a high of $0.1210.
In October 2025, GRT slid again, reaching $0.088, and at the start of November the token was trending near $0.057. In December, it plummeted to the $0.046 range as market sentiment turned negative.
At the start of January 2026, GRT was holding the $0.04 range, and in March it slipped to $0.0255 as sentiment turned bearish. In April, GRT was trending near the $0.024 range, in May it increased slightly to $0.028, and in June it plunged to $0.019.
GRT has historically shown mixed price action in July, with periods of recovery often followed by renewed selling pressure. July trading has typically reflected broader crypto market sentiment, producing sharp swings and limited directional consistency.
For part of August, GRT traded between roughly $0.0134 and $0.0141, hovering near $0.01338 at one point and continuing to face resistance below $0.01388. The token then rebounded from below $0.0140 to a peak near $0.0193, ending August 2026 around $0.0164. In September, GRT extended its recovery to about $0.0212 before pulling back.
As per the latest data on October 15, 2026, the GRT price is trading near $0.0240, compared to approximately $0.0292 at the beginning of October, reflecting a bearish trend.

