Tesla Stock Falls After Worst Week Since 2022 as Charts Point to $296
Key Takeaways
- •Tesla reported second-quarter revenue of $28.24 billion, up 26% year over year, but adjusted earnings of $0.33 per share missed the $0.51 consensus estimate.
- •Capital expenditures increased 142% to $5.79 billion as Tesla invested in artificial intelligence, Optimus robots and robotaxi production.
- •The stock broke below the $350 support zone after earnings, turning that level into a key resistance area.
- •Technical analysis identifies $296.16 as the next near-term downside target, with the $260 demand zone in focus if that level fails.
- •A move back above $350 and into the prior trading channel would be needed to weaken the current bearish technical setup.
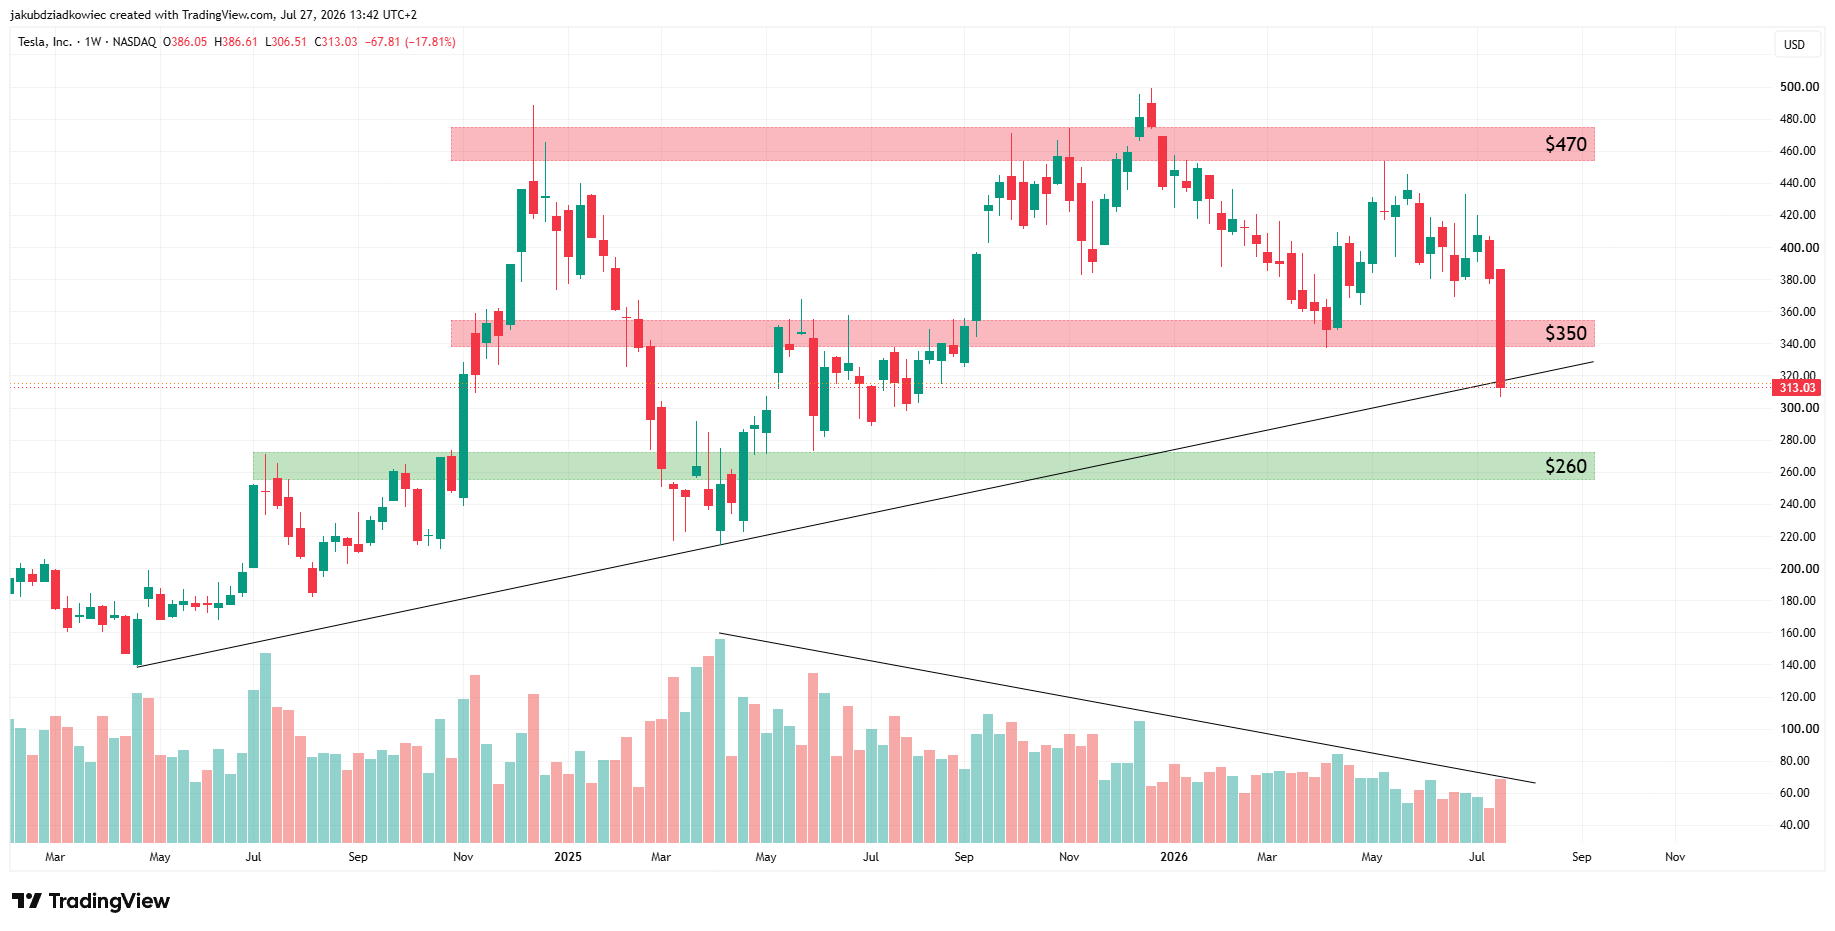
Tesla (TSLA) ended last week at $313.03, losing nearly 18% across five trading sessions in its sharpest weekly decline since 2022. Two separate technical breakdowns now identify $296 as the next downside level to watch.
The drop wiped out the $350 support area after Tesla’s second-quarter report showed record revenue but a significant earnings miss. Early premarket quotes on Monday indicated a modest attempt to rebound toward $321.
Earnings Miss Triggered the Decline
Tesla reported second-quarter revenue of $28.24 billion, a 26% increase from a year earlier and above analyst estimates. However, adjusted earnings came in at $0.33 per share, below the $0.51 consensus forecast, while operating margin fell to 1.4%.
Capital expenditures rose 142% to $5.79 billion as Tesla directed spending toward artificial intelligence, Optimus robots, and robotaxi production. Free cash flow turned negative for the first time since early 2024. That combination matters because Tesla’s valuation increasingly depends on future AI, autonomy, and robotics initiatives at a time when the core auto business is showing thinner profitability.
Some Wall Street analysts viewed the market reaction as excessive. Wedbush Securities managing director Dan Ives described the increase in capital spending as a timing issue rather than a sign that the broader investment case had broken down, telling CNBC: “This is an arms race that’s playing out and we’re only 15% of the way through.”
Other analysts remain divided over whether confidence in Tesla’s AI strategy supports the company’s current valuation while margins are under pressure. The debate leaves investors weighing near-term earnings quality against spending that management says is tied to longer-term growth areas.
Weekly Chart Breaks Below $350 Support
The weekly chart illustrates the extent of the move. Last week’s candle declined 17.81%, cutting through the $350 zone that had served as support since September 2025. That level now becomes resistance.
Tesla’s share price is currently testing an ascending trendline drawn from the 2024 lows. That line has defined the stock’s broader uptrend for more than two years. A weekly close below it would represent a structural break rather than a routine correction.
Below that trendline, the next major demand area is around $260, a zone that generated strong reversals in both 2024 and 2025. On the upside, $470 remains the main ceiling, having capped every rally since late 2024.
A previously identified bullish cup-and-handle formation had projected a $759 target for TSLA. That setup would only become active after a confirmed weekly close above $470, a level that is now much farther from the current price.
Daily Chart Puts $296.16 Target in Focus
The daily chart gives the more immediate signal. Since reaching May highs near $455, TSLA had traded inside a descending parallel channel, respecting both its upper and lower boundaries for almost three months.
On July 23, the day after earnings, the stock broke below both the channel’s lower boundary and the $350 zone in a single move. The session recorded the highest daily volume in months, indicating conviction behind the breakdown rather than a brief shakeout.
The measured move from the channel breakdown points to a target of $296.16, about 5% below Friday’s close. That level also sits just beneath the weekly trendline, making the $296 to $310 range the key area for price action this week.
If sellers push the stock below $296, the next area in focus would be the $260 demand zone, roughly another 12% lower. Conversely, buyers would need to reclaim $350 and move the stock back into the channel to invalidate the bearish structure.
The next driver may not come from the chart. Concrete progress on robotaxi economics or a firm timeline for Optimus could alter the setup more quickly than technical indicators suggest. For now, Tesla shares are positioned between a broken channel above and a two-year trendline below.

