FreightWaves Chart of the Week: Tender Lead Times Climb for Sixth Straight Year, Signaling Structural Shift in Shipper Behavior
Key Takeaways
- •The STLT index measures the gap between when a shipper tenders a load and the requested pickup date.
- •Tender lead times have increased for six straight years and are currently above the recent multiyear average.
- •Seasonal increases occur around early summer and ahead of major holidays as shippers plan around staffing and service risks.
- •Longer planning windows can support carrier operations but may also make intermodal transportation more competitive.
- •Tariffs, geopolitical disruptions and inventory buffers continue to affect shipper planning and freight lead times.
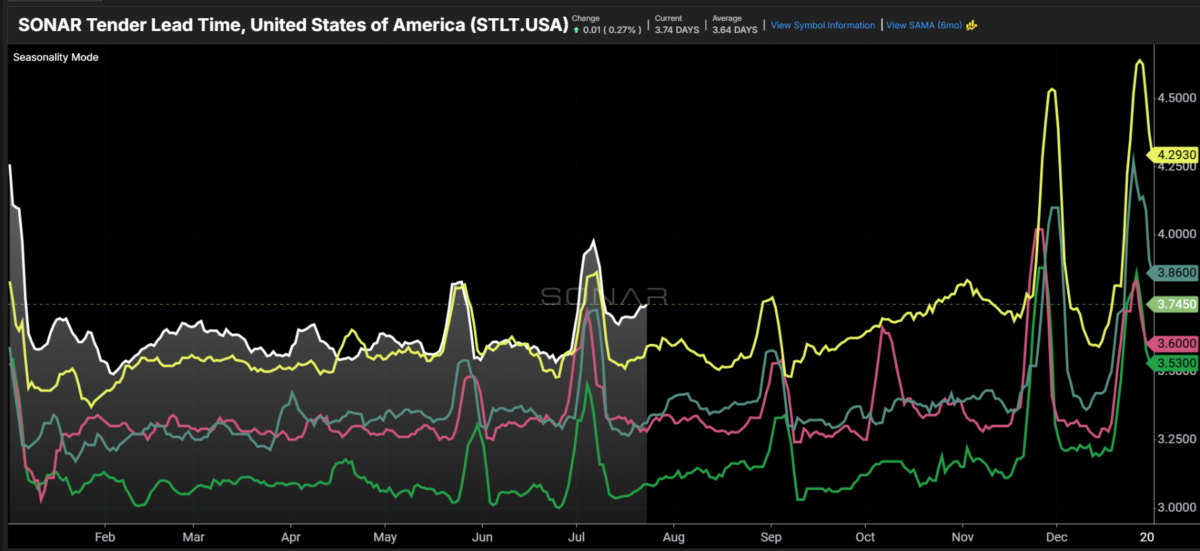
Chart of the Week: SONAR Tender Lead Time – USA (STLT.USA)
The SONAR Tender Lead Time index (STLT) measures the number of days between when a shipper tenders a load and the requested pickup date. For example, a load tendered on Monday for a Thursday pickup carries a three-day lead time. While the metric rarely garners the attention that spot rates or rejection rates command, it offers one of the clearest indicators of how confident — or cautious — shippers feel about their ability to secure trucking capacity.
When the STLT is viewed year over year in seasonality mode, the pattern is unmistakable: lead times have been drifting higher for six consecutive years. The current reading stands at 3.74 days, compared with a running average of 3.37 days from 2022 through 2025. The most recent line on the chart (displayed in white) is tracking noticeably above every prior year at the same point on the calendar — including a sharp late-year spike that surpassed 4.5 days before settling back.
This upward drift is significant because, historically, ample capacity tended to compress lead times rather than extend them. Before the pandemic, shippers with ready access to trucks had little need to plan far ahead — they could tender a load one or two days out and expect a carrier to show up. That is no longer the default behavior, even in years when capacity has been genuinely loose. The persistence of this trend through both tight and loose markets suggests a lasting operational recalibration rather than a cyclical response.
Seasonal Patterns and Structural Trends
Several dynamics are at work simultaneously. First, there is a genuine seasonal component embedded in the data. The recurring bumps around early summer and again heading into the holidays are not noise — they reflect shippers front-loading tenders ahead of Thanksgiving and Christmas, when staffing thins on both the shipper and carrier sides and last-minute freight becomes riskier to move. That constitutes the predictable part of the pattern.
The less predictable element is the underlying trendline itself, which has crept upward year after year, independent of seasonal holiday spikes. Part of this reflects genuinely improved planning — better forecasting tools and tighter sales and operations planning (S&OP) processes mean shippers know their volumes further in advance than they once did. However, lead times have also lengthened during years when rejection rates — a proxy for how difficult it is to find a truck — barely moved, suggesting that something beyond pure capacity anxiety is driving the trend.
Trade policy volatility and pulled-forward import activity in recent years gave shippers additional buffer time before freight needed to move domestically, and some of that cushion has persisted even as the immediate causes have faded.
Implications for Carriers
For carriers, the operational read-through is largely favorable: greater lead time enables better equipment positioning, fewer last-minute scrambles, and, in theory, fewer service failures.
The potential downside is the flip side of that same coin. Longer lead times give shippers more opportunity to plan and route freight — including shifting cargo onto intermodal transport, eroding the urgency that typically favors trucking. Because intermodal movements rely on fixed train schedules and require terminal drayage at both ends, they inherently demand more planning time than over-the-road trucking. That means the same extended lead times that help carriers operate more smoothly also make rail-based alternatives more viable for a larger share of loads. This dynamic is reflected in the rapid growth of domestic intermodal usage over the past few years. Additionally, longer lead times theoretically reduce rejection rates, which softens the overall market.
Implications for Shippers
For shippers, tender lead time serves as a barometer of how much slack — or tightness — exists within their own supply chain planning. Shippers have been compelled to make the upstream portions of their supply chains more resilient against shocks created by erratic trade policy shifts and geopolitical disruptions. Many have been holding more inventory than strictly necessary, affording them more time to move freight downstream.
Trade policy and geopolitical disruptions — including ongoing issues in the Middle East — have created the need to buffer inventories. A new round of Section 301 tariffs went into effect on Friday, replacing the prior temporary measures. Section 301 tariffs, first imposed in 2018 on hundreds of billions of dollars of Chinese imports, have become a standing feature of U.S. trade policy rather than a temporary lever. The administration has numerous additional tariffs in the pipeline, effectively ensuring this level of tariff activity will persist for the remainder of Trump's second term. Shippers have largely adapted to this baseline level of tariffs, though the degree of influence on individual commodities can still shift.
Outlook
Trade policy appears to have somewhat settled as a factor influencing inventory levels, but numerous concerns surrounding global and consumer stability persist and could still affect lead times. If the STLT declines, it would constitute a meaningful signal — carrying both positive and negative implications for transportation managers and providers. Market participants typically watch STLT alongside companion indices such as the Outbound Tender Rejection Index and spot rate data for confirmation of directional shifts in capacity availability and pricing power.
About the Chart of the Week
The FreightWaves Chart of the Week is a chart selection from SONAR that provides an interesting data point to describe the state of the freight markets. A chart is chosen from thousands of potential charts available on SONAR to help participants visualize the freight market in real time. Each week, a Market Expert posts a chart along with commentary on the FreightWaves front page. The Chart of the Week is subsequently archived on FreightWaves.com for future reference.
SONAR aggregates data from hundreds of sources, presenting the data in charts and maps while providing commentary on what freight market experts need to know about the industry in real time. The FreightWaves data science and product teams release new datasets each week and continue to enhance the client experience.

