SUI Holds Long-Term Support as Analysts Monitor Rebound Targets
Key Takeaways
- •SUI is holding near a major long-term support zone after an extended correction from previous cycle highs.
- •BitGuru identified $0.77 as a near-term resistance level that could matter for a short-term rebound setup.
- •CryptoPatel described the $0.60–$0.90 area as a potential accumulation range for buyers.
- •Nology warned that SUI may still test around $0.61 before a stronger recovery attempt develops.
- •Analysts said SUI must defend support and reclaim resistance before a broader trend reversal can be confirmed.
SUI continued to trade near a major long-term support zone after an extended correction from earlier highs, with several technical analysts describing the current area as an important decision point for the token’s next move.
Analysts said the recovery outlook depends on whether SUI can maintain support near current levels and reclaim nearby resistance. BitGuru identified a possible rebound toward the $0.77 resistance area, while other analysts highlighted the $0.60–$0.90 range as a potential accumulation zone. The focus on these nearby levels reflects how traders often use support and resistance to assess whether a decline is stabilizing or whether sellers still control the trend.
SUI Tests a Long-Term Technical Support Area
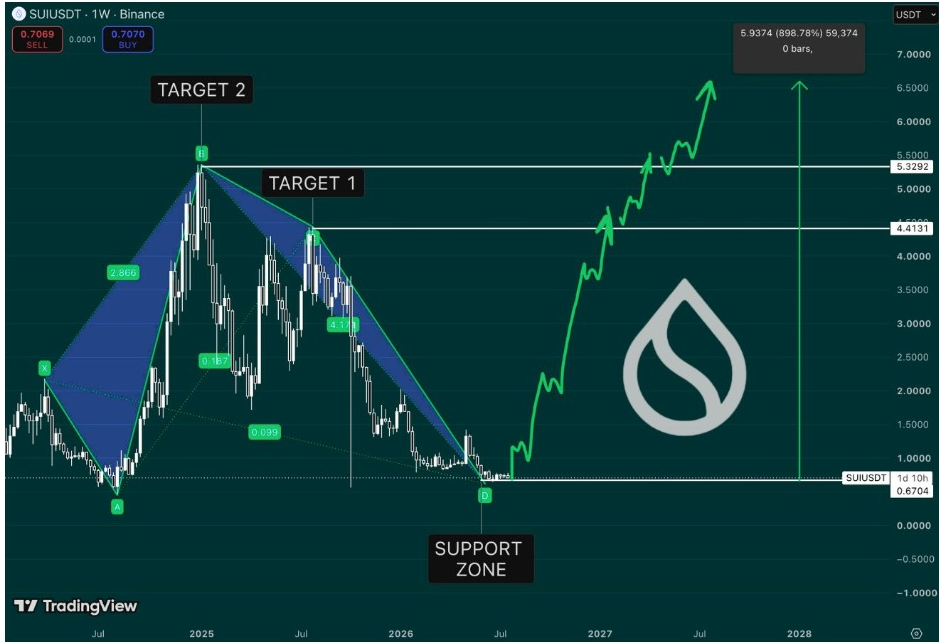
SUI has recently traded around the $0.70 level following a prolonged pullback from previous cycle highs. The weekly chart shows price moving back toward a longer-term demand area, where buying pressure has emerged after recent selling activity.
The Sui Community, in a post on X, pointed to the continued importance of the current support zone within the token’s broader bull-market structure: https://x.com/Community_Sui/status/2081491750539948076?s=20. According to that analysis, buyers are still defending the area, keeping the possibility of a wider recovery intact.
The weekly chart referenced in the analysis showed earlier recovery targets near $4.40 and $5.32. However, SUI would first need to stabilize above the current support region before attempting to move toward those higher resistance levels.
A breakdown below the support zone would weaken the bull-market scenario. In that case, traders could look for another area of interest as the market shifts attention to lower levels. For now, the weekly structure remains central because it frames the broader trend, while shorter-term charts are being used to track whether momentum is beginning to shift.
BitGuru Watches Short-Term Rebound Setup
On the shorter-term structure, BitGuru said SUI was showing signs of a possible rebound after holding a key support zone: https://x.com/bitgu_ru/status/2081347410916237455?s=20. The analyst said continued buyer control could push the token toward resistance near $0.77.
The four-hour chart showed SUI recovering after a test of the lower support region. BitGuru’s setup indicated that a breakout above nearby resistance could generate momentum for a stronger upward move.
The short-term structure also showed price attempting to build a base after a downtrend. Buyers would need to reclaim resistance levels before a trend reversal could be confirmed.
A move above the $0.77 area would improve the market structure and could open a path toward higher recovery targets. If SUI fails to break resistance, the token could remain inside its current consolidation range. This makes the $0.77 area a near-term level to watch alongside the broader support zone, rather than a confirmation by itself of a full recovery.
Analysts Highlight $0.60–$0.90 Accumulation Range
From a broader perspective, CryptoPatel described SUI as a potential accumulation opportunity after the recent correction: https://x.com/CryptoPatel/status/2081341261466702293?s=20. The analyst identified the $0.60–$0.90 range as an important zone where buyers could be positioning.
CryptoPatel’s long-term chart showed possible targets near $5, $10, and $20 if SUI completes a larger recovery cycle. The analyst said the current support zone is likely to play a key role in any future expansion.
The weekly structure showed SUI holding near a strong support area after a significant decline from earlier highs. The chart also marked resistance near $1.42, which would need to be addressed before a broader recovery could develop.
A sustained move below the accumulation zone would delay the recovery outlook and weaken the long-term setup. Holding the current area remains important for buyers attempting to rebuild momentum. Until price reclaims higher resistance, analysts are treating the range as a potential base-building area rather than confirmation that the downtrend has ended.
Nology Warns of Possible Additional Downside
After the recent pullback, Nology warned that SUI may need another downside move before establishing a stronger recovery: https://x.com/nology3000/status/2081574163521888542?s=20. The analyst pointed to a possible test near $0.61 based on the current technical structure.
The daily chart showed SUI trading below several resistance levels after a long period of consolidation. Momentum remained weak, with sellers still controlling short-term price action.
Nology’s chart suggested that a final move lower could complete the current correction before buyers attempt a reversal. Holding the lower support area would be necessary to avoid further weakness.
Even so, SUI remains within a region where long-term buyers have previously shown interest. A successful defense of support could allow the token to rebuild momentum and challenge higher resistance levels, while failure to hold the lower end of the range would keep attention on downside risk before any sustained recovery attempt.

