SUI Price Eyes $1.33 Recovery, but Key Support Levels Must Hold
Key Takeaways
- •SUI fell 0.65% to $0.917 in 24 hours on October 25, 2026, lagging a cryptocurrency market that rose 1.16%, per CoinMarketCap data.
- •Analyst Giannis Andreou outlined two recovery scenarios for SUI hinged on holding $0.8477 or building a deeper base at $0.6508, with a confirmed trendline breakout targeting $1.3331 and, if converted to support, $2.210.
- •More Crypto Online flagged $0.866, the 61.8% Fibonacci retracement, as the lowest ideal support for wave (4) in its Elliott Wave count, with longer-term wave-five projections above $7.
- •SUI is trading below its major exponential moving averages, which the technical overview reads as a sign of continued bearish pressure.
- •CoinMarketCap attributes the modest decline to profit-taking, consolidation, and a lack of buying catalysts, and names the Samsung Wallet and Hashi mainnet rollouts as undated Sui ecosystem developments to watch.
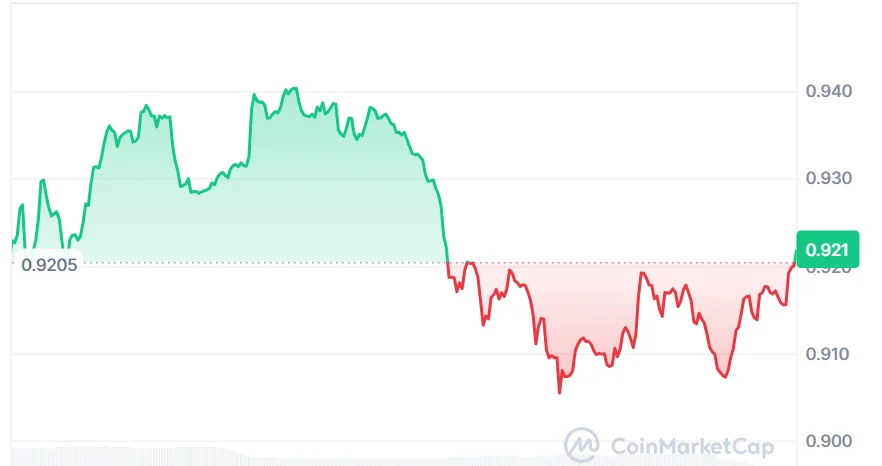
SUI traded at $0.917, down 0.65% over the past 24 hours, even as the broader cryptocurrency market gained 1.16%, according to CoinMarketCap data on October 25 2026. Against that backdrop of relative underperformance, two independent technical analyses published the same day mapped out the support levels that could determine whether the token mounts a recovery. Both converge on the same broad question: which level ends up defining the token's floor.
Analyst Giannis Andreou identified $0.8477 and $0.6508 as potential support levels underpinning two distinct recovery scenarios. In his higher-support setup, a confirmed breakout above a descending resistance trendline would bring $1.3331 into focus, and a successful conversion of that level into support could open a route toward $2.0210. Separately, the analysis account More Crypto Online flagged $0.866 as the lowest ideal support for wave (4) within its Elliott Wave count, adding a Fibonacci-based reference just above Andreou's first level.
Two Recovery Routes on the Daily Chart
Andreou's daily chart places the descending trendline between current support and a possible recovery toward higher resistance levels. In chart analysis, support describes a price zone where declines have previously stalled, while resistance marks where advances run into selling. Holding $0.8477 would preserve Andreou's first scenario, but buyers would still need to break above that trendline. A rebound on its own would therefore leave the larger technical hurdle unresolved.
His setup requires confirmation before $1.3331 becomes the next focus. That level also carries a second condition: once reclaimed, it must be established as support. Only then does the outlined route extend toward $2.0210.
If $0.8477 fails, the alternative scenario looks for a deeper base around $0.6508. That path requires considerably more rebuilding before the chart can support the same recovery discussion. Under it, buyers would first need to reclaim $0.8477, then clear descending resistance and work back toward $1.3331 — and the alternative also allows for another pullback along the way.
$SUI : WHICH SUPPORT GETS TO WRITE THE COMEBACK?
SUI's daily chart maps two possible recovery routes around $0.8477 and $0.6508.
If $0.8477 holds, a rebound could test the descending trendline, with a confirmed breakout bringing $1.3331 into focus.
Turning that resistance… pic.twitter.com/QityjdFF5J
— Giannis Andreou (@gandreou007) October 25, 2026
The post frames the two levels as competing candidates to anchor the next advance. These scenarios describe conditional recovery paths rather than confirmed reversals or guaranteed price targets. The outcome rests on where buyers establish support and whether subsequent rebounds can overcome resistance. The supplied technical overview additionally places SUI below its major exponential moving averages, a sign of continued bearish pressure; such averages track price trends while assigning greater weight to recent trading sessions.
Fibonacci Support Draws Attention
More Crypto Online's $0.866 level adds another reference point just above Andreou's $0.8477 support. The account identifies it as the 61.8% Fibonacci retracement and the ideal low of wave (4). The two levels sit within roughly two cents of each other, making that zone a closely watched area. Fibonacci retracements mark potential reaction levels within a prior price move, while Elliott Wave analysis organizes market swings into proposed sequences — meaning the wave interpretation remains dependent on how price behaves from here.
$SUI is approaching the 61.8% retracement at $0.866. This is the lowest ideal support level for wave (4). pic.twitter.com/7HYcLh1Bnq
— More Crypto Online (@Morecryptoonl) October 25, 2026
On a longer-term chart, More Crypto Online projects wave-five targets above $7. That projection sits apart from Andreou's nearer-term recovery levels and does not establish an immediate price objective.
Short-Term Levels and Upcoming Watch Items
CoinMarketCap's shorter-term outlook places the first test at $0.90. Holding that support could allow a retest of $0.95, while losing it risks a slide toward $0.85. Those markers bracket the current price from both sides, sitting nearer to spot than the daily-chart scenario levels and framing a shorter horizon within the wider analyst ranges. The platform's commentary attributes the token's modest decline to profit-taking, consolidation and a lack of immediate buying catalysts, and notes that thin weekend liquidity could amplify minor selling.
CoinMarketCap also names the Samsung Wallet and Hashi mainnet rollouts as developments worth watching for the Sui ecosystem (the Layer 1 blockchain behind the SUI token), though the supplied material provides no confirmed dates or measurable price effects for either.
For now, SUI's recovery case depends on holding support and clearing descending resistance. As long as $0.8477 stands, the path toward $1.3331 remains in play; a loss of that level would shift attention toward the deeper $0.6508 base scenario. With the ecosystem rollouts still undated, those chart levels remain the reference points for how the recovery discussion develops.

