SUI Tests $0.67 Support as Falling Wedge Tightens
Key Takeaways
- •SUI closed near $0.68 on July 27 after falling 5.9% and briefly touched a low near $0.676 before stabilizing.
- •BitGuru’s four-hour chart places near-term support around $0.6734, with $0.6591 marked as the lower invalidation level.
- •A move above $0.70 could open a path toward $0.72 and the $0.747 to $0.752 resistance band.
- •Pure8’s weekly chart identifies the main demand zone between $0.46 and $0.60, with SUI trading just above that range.
- •Analysts said the larger bullish scenarios, including a falling wedge and harmonic reversal, remain conditional on stronger volume and higher-level reclaiming.
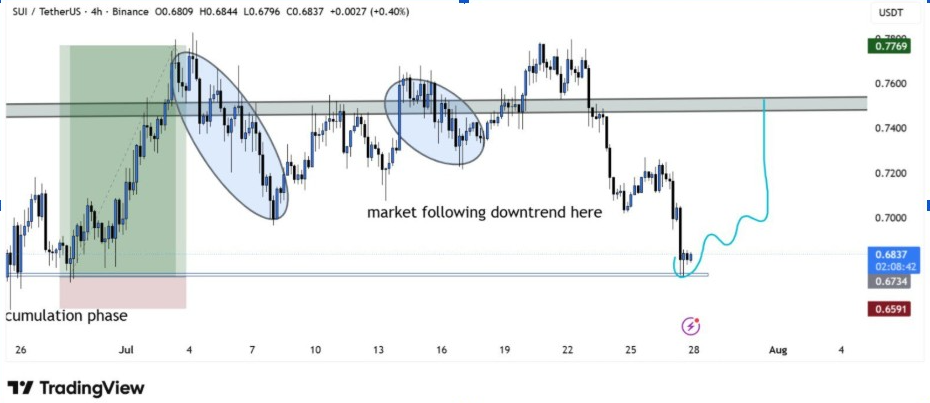
SUI price traded near $0.68 after a steep pullback erased its latest recovery attempt. The token closed near $0.68 on July 27 after falling 5.9%. It reached a session low near $0.676 before stabilizing.
Several charts now place SUI at an important decision area. Short-term support overlaps with a broader weekly demand region, so the current move matters not just for intraday traders but also for a larger support zone that has drawn analyst attention before. The immediate structure remains fragile, although selling pressure has eased near the current base.
A rebound toward $0.75 remains possible if buyers defend $0.67. Another breakdown could expose the lower end of the long-term accumulation range.
SUI Price Tests the $0.67 Support Zone
BitGuru’s four-hour chart places the nearest support around $0.6734, just below the current market price near $0.6837. Buyers have already reacted from this area, yet the bounce remains small and has not changed the wider downtrend.
A move above $0.70 would provide the first sign of improving momentum. From there, SUI crypto could retest $0.72 before challenging the wider resistance band between roughly $0.747 and $0.752.
That upper zone previously acted as support before the latest selloff. Consequently, it now represents the main barrier separating a temporary relief bounce from a stronger short-term recovery.
However, the setup weakens below $0.6734. BitGuru’s chart marks $0.6591 as the lower invalidation area, so a sustained break beneath that level would increase the risk of another leg down.
SUI Crypto Falling Wedge Compresses Near Its Base
Meanwhile, top market analyst Crypto With Gopal highlighted a large falling wedge on the daily chart. Price continues to compress between descending trendlines, while repeated tests of the lower boundary suggest sellers are gradually losing control.
Still, SUI crypto must break above the descending resistance line and hold the breakout with stronger volume before the bullish pattern gains confirmation.
The chart maps a broad upside target near $3 after confirmation. Nevertheless, that level sits far above the current price and would require several resistance areas to fall first.
Weekly Demand Zone Keeps Bulls Interested
Additionally, Pure8’s weekly chart identified the final major demand area between $0.46 and $0.60. SUI crypto currently trades just above that range, while secondary levels around $0.6617 and $0.6049 provide closer support.
This zone carries historical importance since it overlaps with the base formed before the 2024 expansion. Moreover, trading volume previously increased around the same region, showing that buyers responded aggressively there in the past.
Even so, the weekly trend has not yet turned bullish. SUI crypto trades well below the major moving average near $1.56, meaning any recovery toward $1.46 to $1.56 could encounter heavy supply.
Pure8’s longer-term map places further targets at $2.18, $3.49, $4.23 and $6.52. Based on the circulating supply used in the analysis, those levels correspond to market capitalizations of roughly $8.8 billion, $14.1 billion, $17.1 billion, and $26.4 billion. The $1.46 target implies approximately $5.9 billion.
Meanwhile, the fully diluted valuations range from about $14.6 billion at $1.46 to $65.2 billion at $6.52. Therefore, the higher targets require both a technical reversal and considerable market-value expansion.
Analysts Track a Broader Reversal Structure
Sui Community’s weekly harmonic chart also presented the current area as a possible turning point.
The structure showed a developing higher low above long-term support. Its completed D-leg sat close to the current market region.
The projected move pointed toward approximately $6.
However, that scenario depended on a full trend reversal and sustained expansion over several months.
SUI crypto would first need to reclaim $1. It would then need to break the weekly moving average and hold above $1.46.
Further resistance would appear near $2.18, $3.49 and $4.23.
A $6 price would imply a circulating market capitalization near $24.31 billion. Its fully diluted valuation would reach $60 billion.
Those valuations show why the harmonic target should remain a conditional scenario rather than a near-term forecast.
The immediate SUI price outlook depends on $0.67 support. Holding that level could support a recovery toward $0.70, $0.72 and $0.75.
A sustained break below $0.6591 would weaken the short-term reversal case. It could return attention to $0.6049 and the wider $0.46–$0.60 demand region.

