Stacks (STX) Climbs 7% Toward the Level Where Its Last Rally Began
Key Takeaways
- •Stacks (STX) gained roughly 7.2% to trade at $0.309 after touching $0.311, according to the Binance STX/USDT daily chart.
- •The rally carried the token back above the 0.500 Fibonacci retracement near $0.292 and through the short-term downtrend line, after buyers absorbed a two-day slide just above the 100-day moving average at $0.262.
- •The 14-day RSI climbed to 42.4 and crossed above its signal line at 39.7, the first bullish crossover since the mid-October peak, though it remains below the neutral 50 level.
- •Key overhead resistance sits at $0.333-$0.339, where the 0.382 Fibonacci retracement converges with the 50-day moving average, and reclaiming $0.339 as support could open a path toward the 0.236 level near $0.383.
- •With volume modest at about 2.93 million STX and the candle unclosed, a close back below the midpoint near $0.292 could turn the breakout into a bull trap and put support at $0.251-$0.262 back in play.
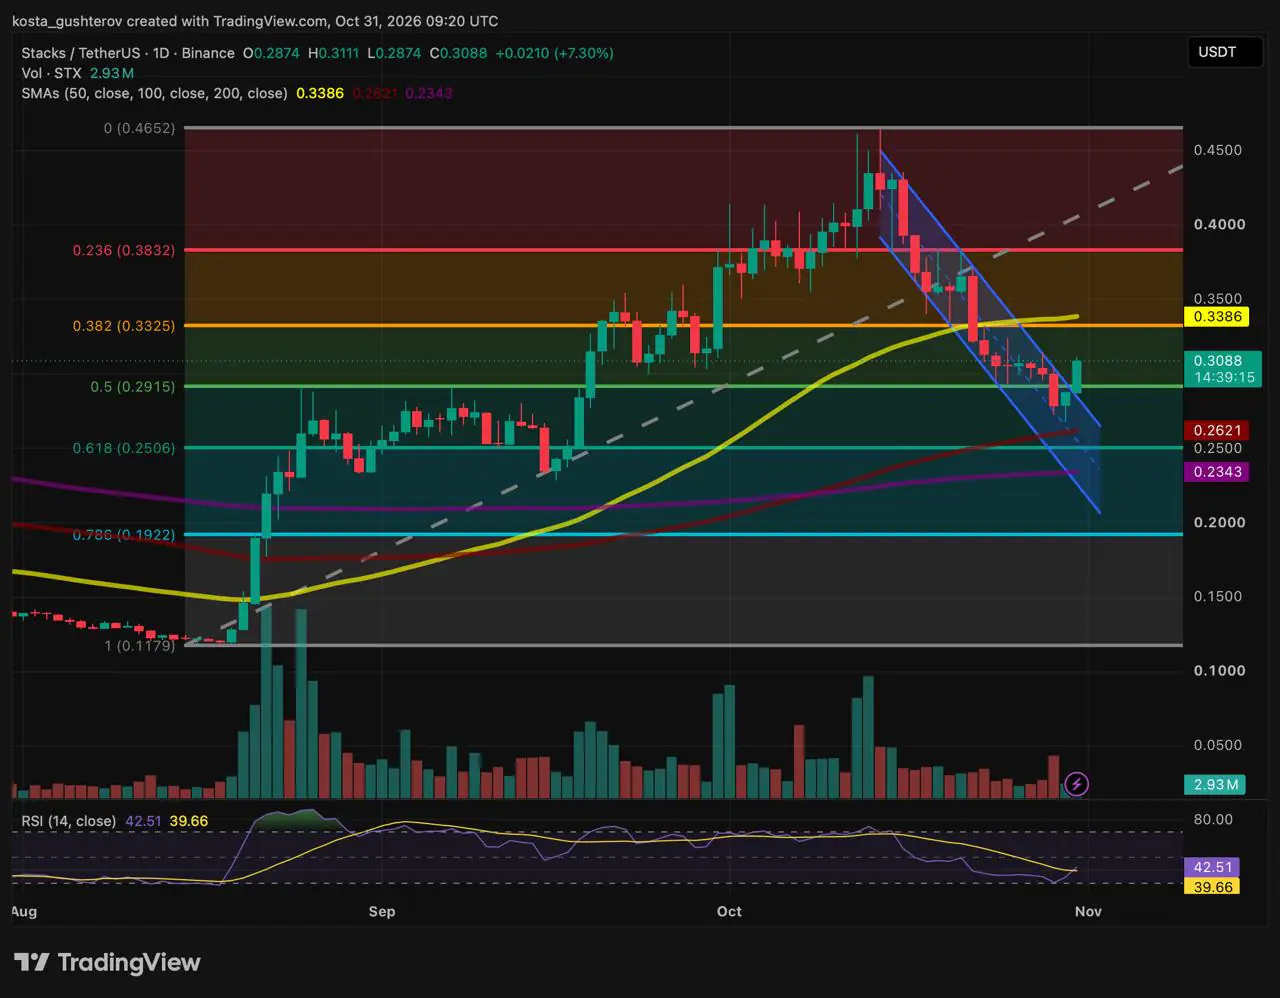
Stacks (STX) traded at $0.309 on the day, up roughly 7.2%, or $0.021, after touching $0.311, according to the Binance STX/USDT daily chart. The advance carried the token back above the 0.500 Fibonacci retracement near $0.292, the midpoint of its entire climb from the August low, and returned it to the neighborhood where its previous rally began. Stacks itself is a smart-contract layer built on Bitcoin, and STX is its native token, used to pay transaction fees and to earn Bitcoin rewards by locking the asset through the protocol's Stacking mechanism.
Two Days of Selling, Undone in a Single Session
Stacks spent most of October handing back its gains. After peaking at $0.465 in the middle of the month, the price retreated for several weeks, slipped beneath its 50-day moving average late in October, and drifted lower under a short-term downtrend line.
Sellers pressed harder over the past two sessions. They pushed STX below the 0.500 Fibonacci level near $0.292, the halfway point of the entire run from the August low, and a long lower wick stretched toward the 100-day moving average at $0.262 and the 0.618 golden pocket near $0.251. Buyers stepped in just above the 100-day average and absorbed the move.
A Session That Opened at Its Low
Today's candle opened at $0.287, and that is still its low. No seller has printed a lower price since the open. Buyers spent the session pushing the other way: back above the midpoint, up to $0.311, and through the downtrend line that had capped every bounce since late October.
Volume remains the weak spot. About 2.93 million STX has changed hands so far, a modest total, and the candle has not yet closed. A finish above the midpoint would make the two-day dip below it look like a bear trap, one that drew sellers in just above the 100-day average before turning on them, and would ease the immediate breakdown threat. A finish below it would leave today as a bounce that ran out of buyers.
Momentum Turns, Quietly
The 14-day RSI, a momentum indicator that measures the balance of buying and selling pressure, has hooked up to 42.4 and crossed above its signal line at 39.7, the first bullish crossover since the mid-October top. That points to fading selling pressure behind the pullback. The RSI is still below the neutral 50 line, however, so buyers have won back ground without yet taking control.
The Wall Near $0.33
Getting back above the midpoint repairs the damage of the last two days. The level that would change the picture sits 8% to 10% higher, where the 0.382 Fibonacci retracement near $0.333 converges with the 50-day moving average at $0.339.
The $0.333 area also carries history. It is where STX found its footing in late September, just before the final leg up to $0.465. A zone that once acted as a launch pad now stands overhead, and the price has to fight back through it from below.
Why the Longer-Term Trend Still Holds
The moving averages have kept their bullish ordering. The 50-day at $0.339 sits well above the rising 100-day at $0.262, which in turn sits above the 200-day at $0.234, the arrangement of an uptrend. The October pullback has dented short-term momentum without reversing it, which makes today's move a recovery inside a correction rather than the end of one.
Where the Levels Sit
The Fibonacci grid, a ladder of retracement percentages traders use to frame potential support and resistance, runs from the August low near $0.118 to the October peak near $0.465. Measured from today's $0.309, the overhead marks are the session high at $0.311, less than 1% away; the ceiling at $0.333–$0.339, 8% to 10% up; the 0.236 level near $0.383, about 24% above, where the mid-October breakdown began; and the $0.465 peak, roughly 51% higher.
Below the market, the supports are the midpoint near $0.292, about 5.5% down, with today's $0.287 open just under it; the 100-day average and golden pocket at $0.251–$0.262, 15% to 19% lower; the 200-day at $0.234, about 24% lower; and, deeper still, the 0.786 level near $0.192 and the August launch point near $0.118.
What the Close Could Decide
If STX holds above the midpoint and closes near or above $0.309, the break of the downtrend line would stand, with the RSI crossover behind it. That could open a move through the upper Fibonacci band toward the $0.333–$0.339 ceiling. Turning $0.339 back into support in early November would be the step that opens a wider recovery toward the 0.236 level near $0.383.
If it fails, the breakdown would show up as buyers unable to hold $0.300 on thin volume, an upper wick forming under the rally, and a close back below the midpoint. Today's breakout would then become a bull trap, the $0.287 open would be at risk, and the 100-day average and golden pocket would be back in play for a full retest.
In either scenario, the sessions that follow will carry more weight than today's high. One finish above $0.339 would say more about this rebound than another 7% day that stops short of it.
This article is provided for informational purposes only and does not constitute financial or investment advice. Technical levels and scenarios discussed do not guarantee future price movement.
Source: Coindoo

