SPX6900 Price Prediction 2026–2032: Technical Analysis and Long-Term Forecast
Key Takeaways
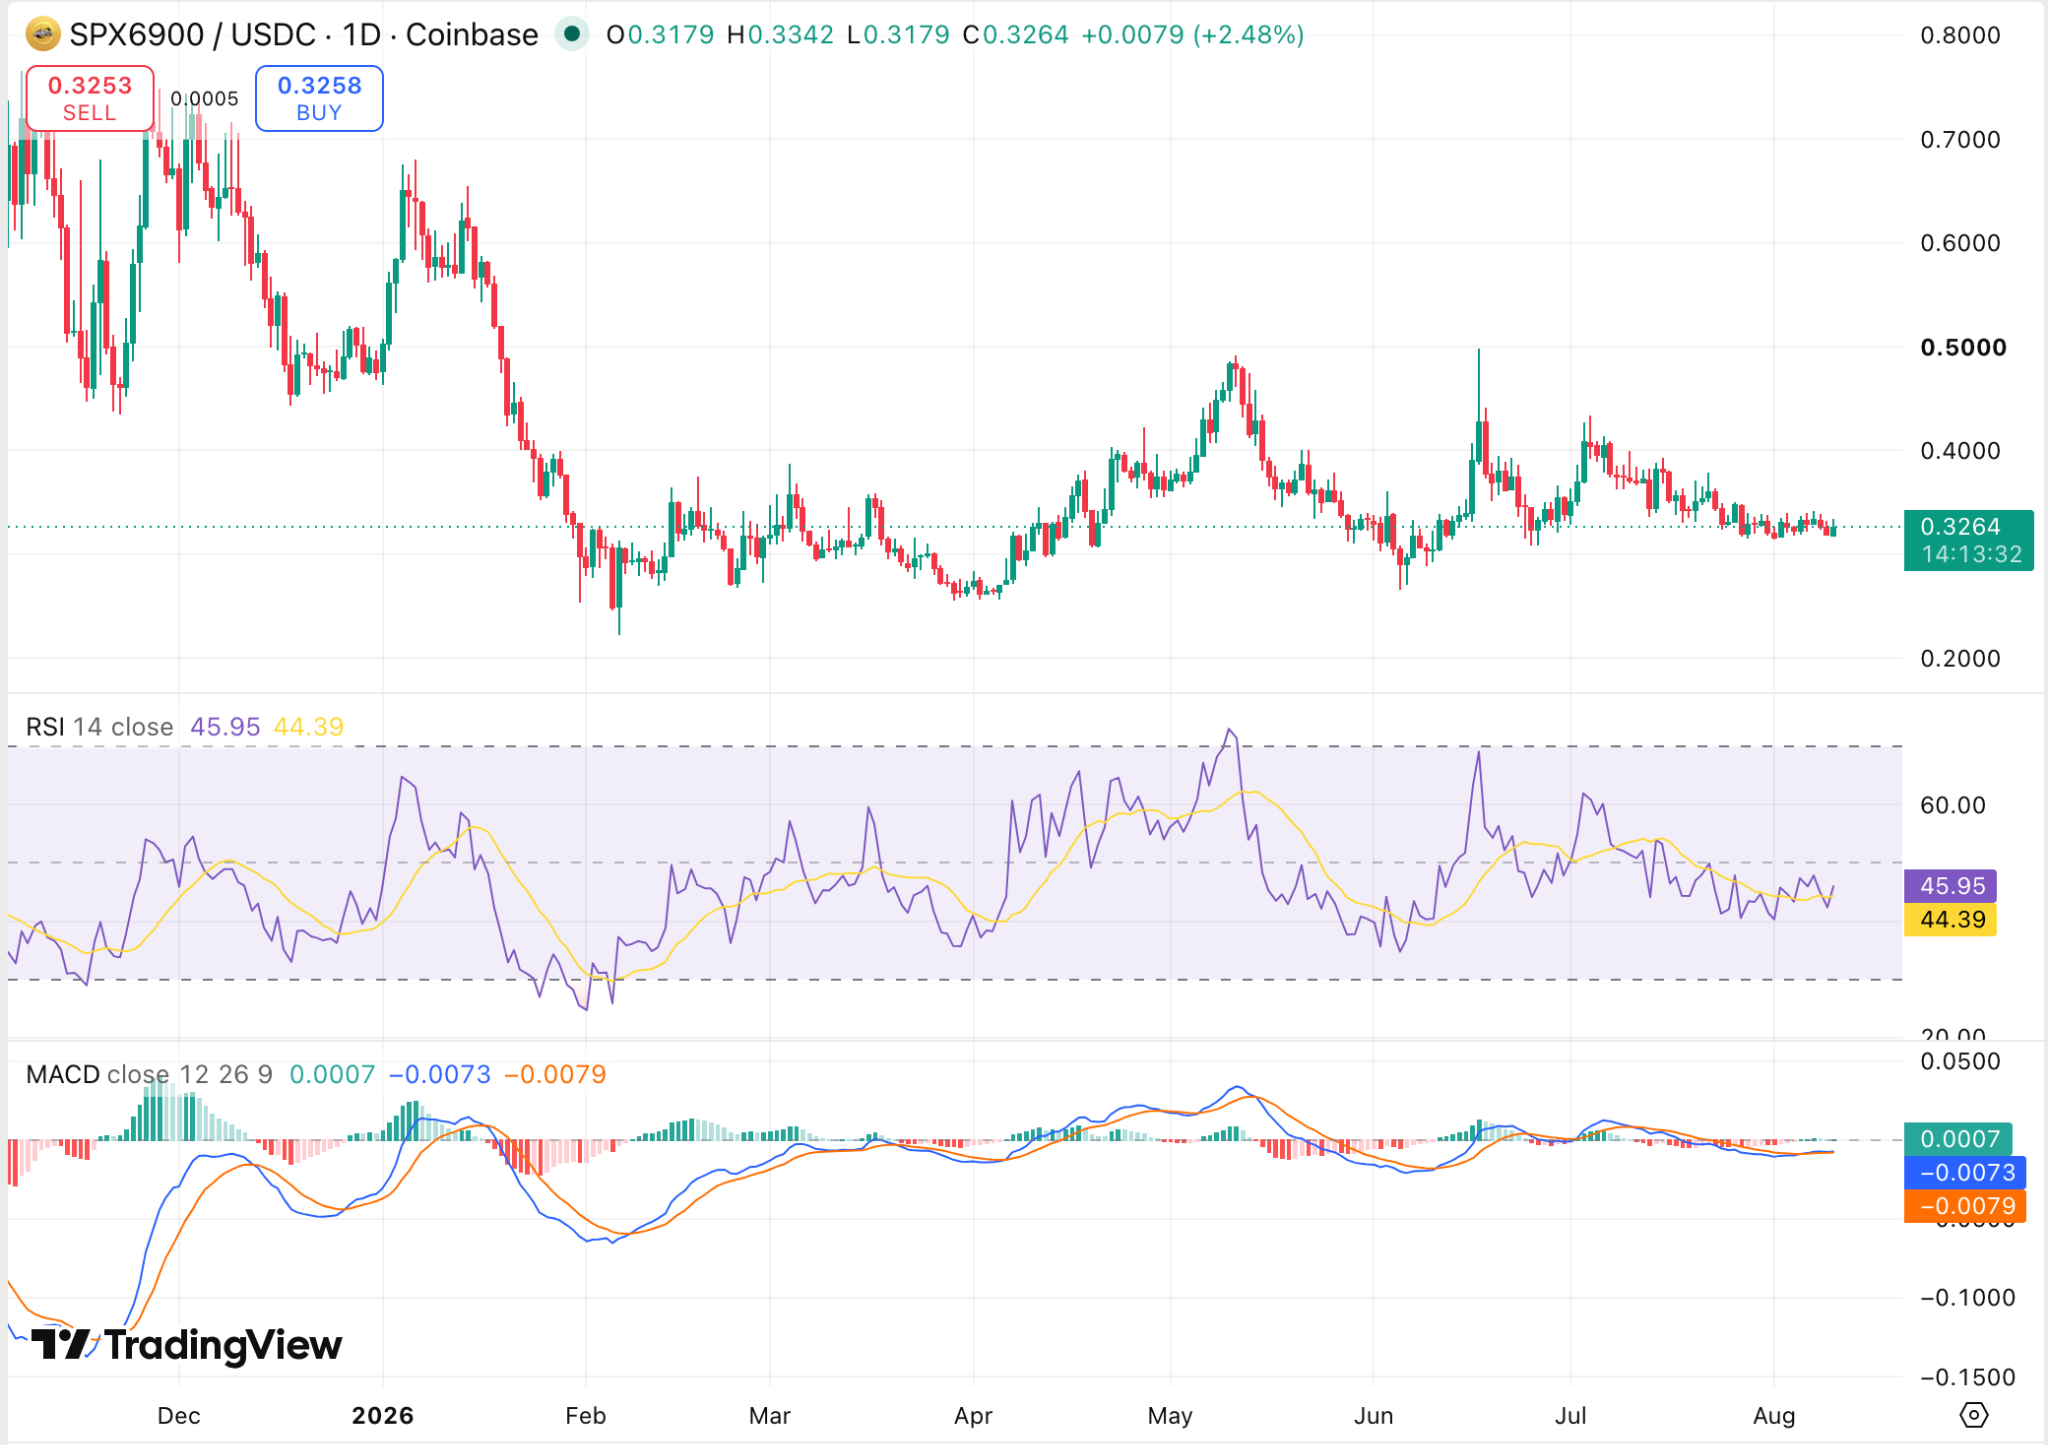
- •SPX6900 traded at $0.3264 on 10 August 2026 after recovering from an intraday low of $0.3179 and rising 1.26% over the previous 24 hours.
- •Immediate support was identified near $0.3234, while resistance was placed around $0.3300 to $0.3326.
- •The daily RSI and MACD suggested neutral conditions with a mild bullish tilt, but the article said SPX still needs stronger follow-through to extend the rebound.
- •The token’s August 2026 forecast ranges from a minimum of $0.27 to a potential high of $0.3378, with a projected average of $0.3156.
- •SPX6900 is described as a meme coin whose value depends mainly on community support, social media activity, and speculative trading rather than traditional utility.
SPX6900 (SPX) is a meme cryptocurrency operating primarily on the Ethereum blockchain. The token's value is driven largely by community engagement, social media activity, and speculative trading. Unlike utility tokens or protocol governance assets, meme coins like SPX typically derive their market value from cultural momentum and retail sentiment rather than on-chain revenue, staking yields, or product usage. SPX is available through spot markets and perpetual contracts on both centralized and decentralized exchanges. Leveraged trading carries heightened risk, as meme coins are known for sharp and unpredictable price swings.
SPX can be stored in wallets such as Trust Wallet, Bitget Wallet, and Ledger hardware devices. The token has approximately 930.99 million SPX in circulation, with a maximum supply of 1 billion.
SPX6900 first attracted broader market attention during a powerful rally in 2024, when the token surged nearly 9,000% within a single month. That performance placed SPX among a cohort of Ethereum-based meme tokens that captured retail interest during the 2024 cycle, and it has kept traders focused on SPX price projections for 2026 and the years beyond.
Current Market Overview
On 10 August 2026, SPX6900 (SPX) traded at $0.3264, up 1.26% over the preceding 24 hours. Immediate support sits near $0.3234, while resistance is positioned between $0.3300 and the daily high of $0.3326. The token recorded a 24-hour low of $0.3179 before recovering sharply toward the upper end of its range. The rebound followed an earlier drop below $0.3234, though SPX subsequently reclaimed that level and held above it.
The token began August 2026 near $0.3204 before experiencing several volatile sessions, briefly moving above $0.3000 as the month progressed while remaining well below its historical peak. According to the latest data, SPX traded near $0.3770 at the start of July 2026.
Technical Analysis
24-Hour Timeframe
The daily structure remains constructive, with SPX holding above key support and preserving its recovery pattern. Sustained strength could support another push toward nearby resistance and maintain a positive short-term outlook.
Momentum indicators show signs of gradual improvement. The Relative Strength Index (RSI) stands at 45.95, slightly above its 44.39 average, indicating neutral momentum with a mild bullish tilt. The MACD line sits at -0.0073, above the -0.0079 signal line, while the histogram remains positive at 0.0007. This configuration suggests momentum is stabilizing, though SPX still requires stronger follow-through to sustain an upside move.
4-Hour Chart
The shorter-term structure reveals repeated rebounds from key support areas during the observed period, indicating that SPX continues to attract demand on pullbacks and maintains a relatively stable four-hour framework.
SPX6900 continues to trade sideways on the four-hour timeframe as recent weakness limits directional momentum. The RSI reads 47.38, slightly above its 46.02 average, signaling neutral conditions with a mild recovery bias. The MACD remains slightly negative, indicating that short-term downward pressure has not fully dissipated. Stronger momentum above nearby resistance could improve the four-hour structure and support further recovery.
Short-Term Outlook
SPX6900 remains positioned between nearby support and resistance, leaving the short-term outlook balanced. Holding above support could preserve the recovery structure and keep another upside attempt open. A stronger breakout through resistance would strengthen the bullish setup and create room for additional gains. Conversely, renewed weakness below support could shift momentum lower and expose SPX to another pullback.
Price Predictions
August 2026
SPX is projected to trade within a range during August, with a potential high of $0.3378, an average price of $0.3156, and a minimum trading level of $0.27.
Full-Year 2026
SPX6900 could trade between $0.2934 and $0.3975 during 2026. The token's average price is projected near $0.3421 as market conditions develop throughout the year.
2027
SPX6900 could trade between $0.4823 and $0.6393 during 2027, with an average price forecast near $0.5608 as market conditions and demand evolve.
2028
SPX6900 could trade between $0.6514 and $0.8461 during 2028, with an average price forecast near $0.7488 for the year.
2029
SPX6900 could trade between $1.04 and $1.28 during 2029, with an average trading price forecast near $1.16.
2030
SPX6900 could trade between $1.11 and $1.53 during 2030, with an average trading price forecast near $1.32.
2031
SPX6900 could trade between $1.28 and $1.87 during 2031, with an average trading price forecast near $1.60.
2032
SPX6900 could trade between $1.44 and $1.91 during 2032, with an average trading price forecast near $1.66.
Analyst Forecast Summary
SPX could reach a maximum price of $0.3975 by the end of 2026. In 2027, SPX may trade between $0.4823 and $0.6393, depending on broader market momentum. The 2032 forecast places SPX between $1.44 and $1.91, with an average price near $1.66. These projections remain speculative and are subject to change as cryptocurrency market conditions evolve. Long-range cryptocurrency forecasts beyond a one-to-two-year horizon carry particularly wide uncertainty, as meme coin valuations can shift rapidly with changes in social sentiment, exchange listing availability, and broader crypto market cycles.
Long-Term Price Milestones
Reaching $5 would require significant price and market capitalization growth. Current projections indicate SPX may approach the $5 level sometime after 2032, contingent on stronger adoption and sustained demand.
SPX6900 is considered unlikely to reach $10 based on current price forecasts. Prediction models place the token's highest projected value near $8.06 by 2046, suggesting long-term growth potential while remaining below the $10 threshold.
Long-term forecasts point to gradual growth, with stronger momentum expected toward 2029. By 2032, SPX could trade above $1.30, alongside a projected fully diluted valuation (FDV) near $427.33 million.
SPX6900 depends primarily on community support, meme culture, and speculation rather than traditional utility. Its satirical branding and S&P 500 references parody conventional finance while reinforcing the project's meme-driven identity. The token's name plays on the S&P 500 stock market index, positioning SPX6900 as a self-aware joke about traditional finance benchmarks—a branding approach that has resonated with segments of the crypto-native retail audience.
Historical Price Performance
SPX6900 was launched in August 2023 by its primary creators with an opening price of $0.003 and remained under the radar for over a year.
In October 2023, SPX spiked to $0.023 under bullish control before retreating to $0.008 in December 2023.
From January to May 2024, SPX6900 experienced stagnating price movement, periodically rising to $0.015.
Between September 12 and October 14, 2024, the token surged approximately 5,600%, reaching $0.913 and producing a substantial market capitalization. The token continued making higher spikes through November 7, 2024, before its price deteriorated. On November 21, SPX6900 dropped to $0.450, losing 50% of its value. However, the token recovered and ended 2024 at $0.856.
The meme token entered January 2025 at $0.866 before jumping to $1.55 as circulation and acceptance increased. It corrected sharply in February, averaging $0.66, then declined to the $0.46 range in March. In April, the coin traded near $0.386 before recovering to a peak of $1.11 in May.
On June 11, 2025, SPX reached its all-time high of $1.73, followed by another ATH of $2.27 on July 28. SPX maintained a trading range of $1.06 to $2 in August under bullish dominance, trading at an average of $1.16 in September.
In October 2025, SPX6900 traded near $1.6 before falling to $0.78 in November, a 50% loss. The downtrend continued into December, with the token touching $0.63.
At the start of January 2026, SPX6900 traded near $0.648 before slipping to $0.336 in March. In April, the token traded near $0.28, recovered to $0.42 in May, and declined again to $0.316 in June as market sentiment shifted from bearish to neutral. The roughly 85% decline from the July 2025 all-time high of $2.27 illustrates the volatility profile typical of meme assets, where rapid appreciation during sentiment-driven rallies is often followed by equally sharp drawdowns as attention shifts.
Source: Cryptopolitan | SPX/USD TradingView

