S&P 500 Statistics 2026: Returns, Drawdowns and Key Data
Key Takeaways
- •The S&P 500 ended October 12, 2026 at 7,807.24, a 0.06% decline that left it roughly 0.5% below its 52-week high of 7,844.52.
- •The index has gained 14.05% on a price basis in 2026 and 15.08% with dividends, following total returns of 26.29% in 2023, 25.02% in 2024, and 17.88% in 2025.
- •Since its 1957 launch, the S&P 500 has averaged about 10% in annual returns and finished positive in 74 of the 100 calendar years from 1926 through 2025.
- •The index's deepest recorded drawdown was approximately 82% from 1929 to 1932, while the 2007-2009 financial crisis produced a roughly 49% decline that took until August 2012 to recover.
- •On Polymarket, traders price a 58% chance of the S&P 500 reaching $8,000 and a 60% chance of touching $7,400 by the end of December, though the market is small with about $413,000 in volume.
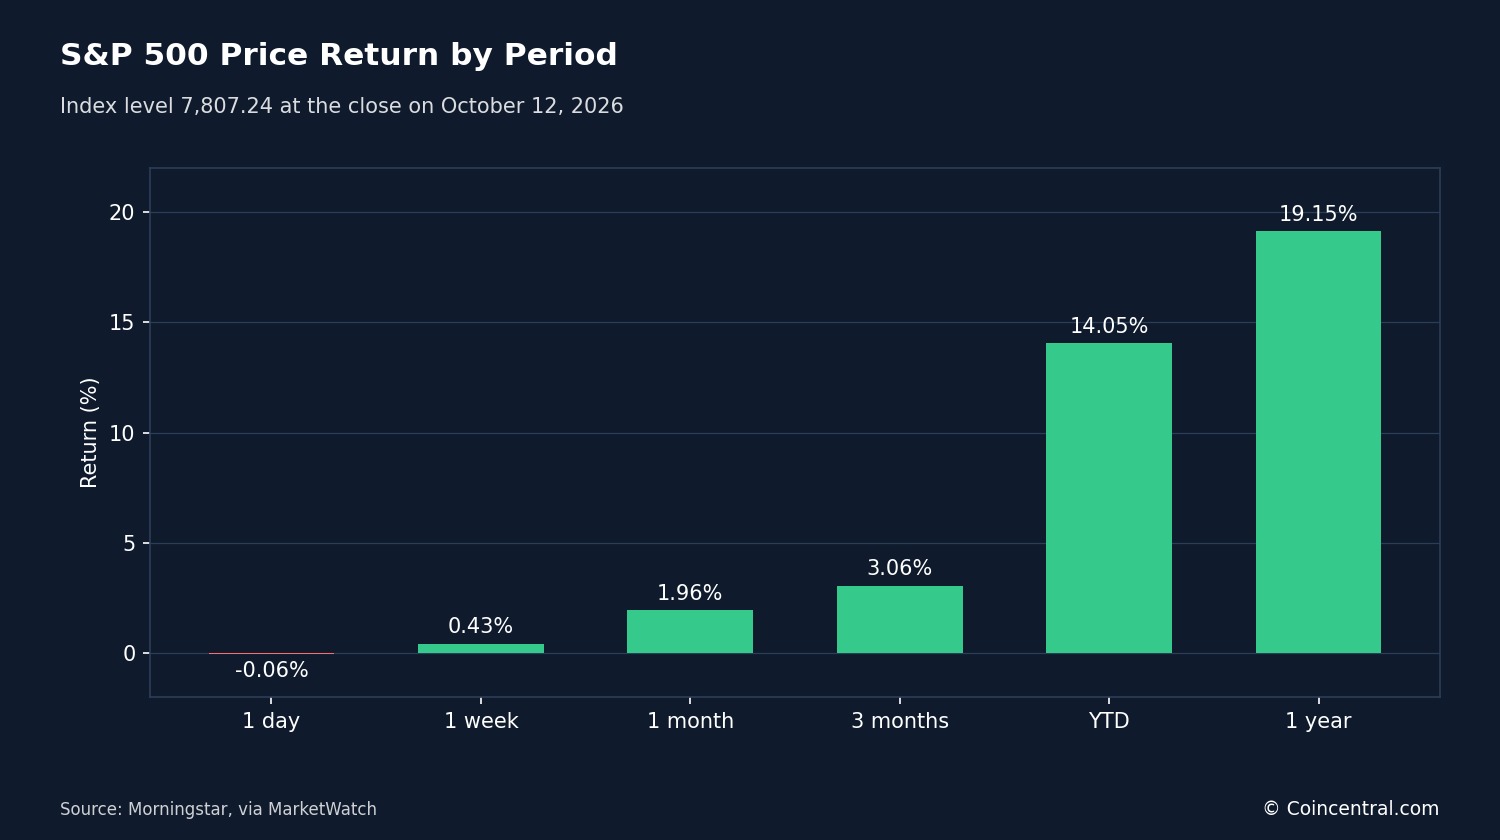
The S&P 500 closed at 7,807.24 on October 12, 2026, slipping 4.30 points, or 0.06%, from the previous close of 7,811.54. The benchmark index is up 14.05% so far in 2026 on a price basis and has gained 19.15% over the past twelve months. The figures below compile the latest data on returns, risk, historical market declines and the odds investors currently assign to future moves.
Unless otherwise noted, figures are as of October 12 or October 13,2026. Past results do not predict future returns.
Key data at a glance
- Latest close: 7,807.24 on October 12, 2026
- 52-week range: 6,316.91 to 7,844.52
- Year to date: 14.05% price return and 15.08% total return
- Average annual return since 1957: about 10%
- Positive calendar years from 1926 to 2025: 74 of 100 (total return)
- Deepest decline on record: about 82%, from 1929 to 1932
S&P 500 Today: Price and Short-Term Performance
The index opened at 7,813.04 on October 12 and traded between 7,796.94 and 7,821.67 before settling at 7,807.24. The modest loss came on a day when the Dow Jones Industrial Average rose 0.38% and the Nasdaq Composite fell 0.44%.
The S&P 500 sits close to its 52-week high of 7,844.52, a peak about 0.5% above the latest close, and stands roughly 23.6% above its 52-week low of 6,316.91.
Longer windows show stronger numbers. The one-year price return is 19.15% and the three-year annualized return is 21.53%. The five-year annualized figure is lower at 12.41%, and the ten-year figure is 13.82%.
Data providers report slightly different short-term figures. The MarketWatch key data panel lists a one-month gain of 2.46%, a three-month gain of 3.88% and a one-year gain of 17.32%. The Morningstar table on the same page shows 1.96%, 3.06% and 19.15% for the same periods. The gap likely stems from the dates used to measure each window.
All of these are price returns. Because a price index leaves out dividends, total return runs higher: the 2026 total return through October 12 is 15.08%, compared with 14.05% for price alone. Morningstar's ten-year growth chart shows $10,000 growing to $38,197 on a price basis — nearly four times the starting amount.
The S&P 500 launched on March 4, 1957. It holds 500 large U.S. companies listed on the NYSE or Nasdaq, and S&P Dow Jones Indices says it covers about 80% of available U.S. market value. That breadth is why the index is widely treated as a stand-in for the U.S. stock market, and why its average return is the figure most often cited as the stock market's overall return.
The index's makeup changes over time. On October 1, S&P Dow Jones Indices announced that Vylor had been added to the S&P 500 and that Twilio is set to join. Vylor gained 3.75% on October 12 and closed at $75.89. That same day, the index provider launched the S&P 500 & HKEX Tech 100 Index together with the Hong Kong exchange. Many other products track the index, including ETFs listed in South Africa and South Korea.
Earnings season adds to the near-term picture. Barron's ran a headline on October 12 saying Wall Street is unusually optimistic about third-quarter earnings; another said it is a high-stakes season, especially for AI stocks.
S&P 500 Average Return by Time Period
Fidelity puts the average annual return of the S&P 500 at about 10% since 1957. Over the past 40 years through December 2025, the average was 11.5%. The figure is widely used as a rough guide to stock market returns, though the outcome depends on the dates chosen. The average is a long-run smoothing — the individual years behind it swing far more widely, as the year-by-year record below shows.
The past ten years, from January 2016 through December 2025, averaged 14.8% a year, and the past five years averaged 14.4%. The 20-year window includes the 2007 housing crisis, which led to the worst recession since the Great Depression, and the 30-year window includes the dot-com crash. Both periods still ended near or above 10% a year.
Curvo, a European investing platform, reports a compound annual growth rate of 10.96% from February 1992 to August 2026. Its shorter windows are close to Fidelity's but not identical; different end dates and calculation methods explain most of the gap.
Investors cannot buy an index directly — they buy funds that track it. Fidelity lists the expense ratio of its 500 Index Fund (FXAIX) at 0.015%, or $1.50 a year on $10,000. Morningstar puts the 2024 average expense ratio for passive U.S. equity funds at 0.08%. Index funds usually cost less than actively managed funds.
S&P 500 Returns by Year
Slickcharts lists total returns for the index back to 1926, when it held 90 companies; it grew to 500 constituents in 1957. These returns include reinvested dividends.
Counting the calendar years from 1926 to 2025, the index gained in 74 and fell in 26. The simple average of those 100 yearly returns is 12.3%. Sixty years gained 10% or more, and 12 years lost 10% or more.
The last three full years were strong. The index returned 26.29% in 2023, 25.02% in 2024 and 17.88% in 2025, and the 2026 total return stands at 15.08% through October 12.
Only two of the last ten full years ended with a loss — 2018 at -4.38% and 2022 at -18.11%. The 2022 drop was the largest yearly loss since 2008.
Good years often come in runs. The index rose for five straight years from 1995 to 1999, with gains between 21.04% and 37.58% each year, then fell three years in a row from 2000 to 2002. That stretch is the longest run of losses since 1939 to 1941. The longest losing streak in the Slickcharts table is four years, from 1929 to 1932.
Dividends added between 1.33 and 2.61 percentage points to the yearly return from 2016 to 2025, helping most in 2019 and least in 2022. Over many years, that gap adds up. The 1950s were the strongest decade in the table at 20.8%, followed by the 1990s at 19.0%. The 2000s were the weakest at 1.2%, a decade that included the dot-com crash and a 37.00% loss in 2008.
How Often the S&P 500 Rises and How Much It Swings
Curvo found that the index had a positive return in 27 of 33 years from 1993 to 2025 — 82% of years. In monthly terms, it rose in 275 of 414 months between1992 and 2026, or 66%. About one month in three is a down month, so a loss in any single month is common even in a rising market. Over a full year, losses are less frequent.
The odds improve as the time frame grows. Monthly returns are positive 66% of the time and yearly returns 82% of the time, per Curvo, and every 20-year and 30-year average in the Fidelity table is above 10%.
Curvo also lists the best calendar years as 1995 at 37.6%, 1997 at 33.4% and 2013 at 32.4%. The worst were 2008 at -37.0%, 2002 at -22.1% and 2022 at -18.1%.
Standard deviation shows how far returns tend to move from the average; a figure of 14.63% means yearly returns often land well above or below the long-run pace. The Sharpe ratio compares return with that risk, and a higher number is better. Value at risk estimates the largest one-year loss at a 95% confidence level, and Curvo's estimate is 12.5%. Three years in its data lost more than that: 2008, 2002 and 2022. Curvo notes that the method assumes normal returns, which real markets are not, and that the measure says nothing about losses beyond the 95% level.
The Cboe Volatility Index, a common gauge of expected swings, stood at 15.45 on October 12 after rising 1.58% on the day. A MarketWatch headline that day said options traders expect larger swings starting later in the month.
S&P 500 Drawdown Statistics
A drawdown is how far an investment has fallen from its previous high; it returns to zero when the index sets a new high. A drop of 20% or more is usually called a bear market, and a drop of 10% to 20% is called a correction. Measured that way, the current market sits barely below its peak: the latest close is about 0.5% under the 52-week high of 7,844.52.
DQYDJ tracks drawdowns back to 1871 using Robert Shiller's monthly data, with figures based on total return, which includes reinvested dividends. Four deep episodes stand out.
The Great Depression decline was the deepest on record. Even with dividends reinvested, the index fell about 82% and took over 15 years to reach a new total-return high; without dividends, recovery took until September 1954.
The 1973 to 1974 decline was shallower at about 39%. The recovery was quick in nominal terms, helped by high dividend yields, but in inflation-adjusted terms the damage was much larger. The dot-com bust left investors underwater for just over six years. The financial crisis was the second-deepest decline in the dataset at about 49%, and recovery to a new high took until August 2012.
Curvo reports different figures because it uses a different method. It lists the longest drawdown as six years and two months, from August 2000 to October 2006, with a low of -44.7%. Its deepest drawdown ran from October 2007 to March 2012, with a low of -50.9%.
The 2020 COVID drop was fast. On daily closes, the decline reached about 34%, and the peak in February, trough in March and new high in August all fell within six months. DQYDJ warns that monthly averages hide sharp drops such as 2020 and the 1987 crash — a daily chart would show a deeper low, and the monthly view understates what investors felt in the moment.
Dividends also change the picture. DQYDJ says they cushion drawdown depth and shorten the time to a new high, with the gap between price-only and total-return recovery largest in the longest episodes.
S&P 500 Compared With Other Indexes and Market Movers
Fidelity compared three major U.S. indexes from January 2016 through December 2025. The Dow Jones Industrial Average returned 13.1% a year, the S&P 500 returned 14.8%, and the Nasdaq Composite returned 17.7%. The S&P 500 sat in the middle: it holds 500 companies, while the Dow holds 30, and the Nasdaq Composite covers stocks listed on the Nasdaq exchange.
Tech stocks weighed on the market on October 12. The Nasdaq 100 fell 0.71%, the largest drop among the major indexes, while the Dow rose as other sectors held up. The Russell 2000, which tracks smaller companies, closed at 2,794.48 after a 0.45% drop. Barron's ran a piece that day arguing AI could help small caps beat megacap tech rivals — an analysis, not a data point.
Overseas markets were mixed. Japan's Nikkei 225 fell 1.82%, while India's BSE Sensex rose 1.54%. Canada's S&P/TSX Composite gained 1.48%, and the FTSE 100 in London rose 0.64%.
Prediction Market Odds for the S&P 500 by December
MarketWatch carries a Polymarket market asking what level the S&P 500 will hit by the end of December. Traders buy “yes” shares that pay $1 if the level is reached, and the price of a share can be read as the market's estimate of the odds.
The market gives a 58% price to a rise to $8,000, about 2.5% above the latest close, and a 60% price to a fall to $7,400, about 5.2% below. Both can happen, because the question is whether the index touches the level at any point — one reason the prices do not add up to 100%. They are not forecasts, and the market is small, with $413,143 in volume. The page headline also shows different percentages from the price history, such as 37% for $7,400 down, so readers should treat the figures with care.
The price history shows how fast odds can move. The “yes” price for a fall to $7,400 sat near 34% on the morning of October 9, jumped to 62% that afternoon and has held near 60% since. Deep declines carry low prices: a fall to $5,200 trades at 2.7%, a fall to $4,500 trades at 2.3%, and a rise to $10,000 trades at 3.35%. The market runs through the end of December, so these odds will keep repricing with new information; earnings season and the options market's expectations for larger swings later in the month are the nearest points on the calendar.
What the S&P 500 Statistics Show
The S&P 500 has gained about 10% a year over the long run, and recent decades have been higher. It has risen in roughly three of every four calendar years since 1926, though have come in uneven steps.
Losses are part of that record. The index fell about 82% from 1929 to 1932 and about 49% from 2007 to 2009, and recovery took between two and fifteen years depending on the episode. The index now sits near a 52-week high after a 19.15% one-year gain, and short-term prediction market odds show traders see moves in both directions by December. None of this data predicts what comes next.
This article is for information only and is not investment advice.
Sources
- FRED: S&P 500 (SP500), Federal Reserve Bank of St. Louis
- MarketWatch: S&P 500 Index (SPX) Overview
- Fidelity Learn: What is the S&P 500 average return?
- S&P Dow Jones Indices: S&P 500
- Curvo: Historical performance of the S&P 500 index
- Slickcharts: S&P 500 Total Returns by Year
- DQYDJ: S&P 500 Drawdown History
This article first appeared on CoinCentral.

