US Stock Indices Bounce Higher, but Buyers Still Face Key Technical Tests
Key Takeaways
- •The Nasdaq 100 fell 6.36% in the previous session, its largest one-day decline since 2020, and the selling pressure spread across the major US stock indices.
- •The S&P 500's decline halted near its 200-day moving average at 7325 and a swing area down to 7300, with upside targets at 7507 and the 100-day moving average at 7619.
- •The Nasdaq Composite is holding above its recent low swing area of 24206-24425 but needs to reclaim the broken 38.2% retracement at 25036 and the 200-day moving average at 25098 to strengthen its bullish case.
- •The Nasdaq 100's push back above the broken 50% retracement level at 27103 is failing, and buyers must get and stay above that level to gain confidence.
- •How buyers handle the technical levels that broke during the selloff will determine whether the rebound extends or the recent lows come back into play.
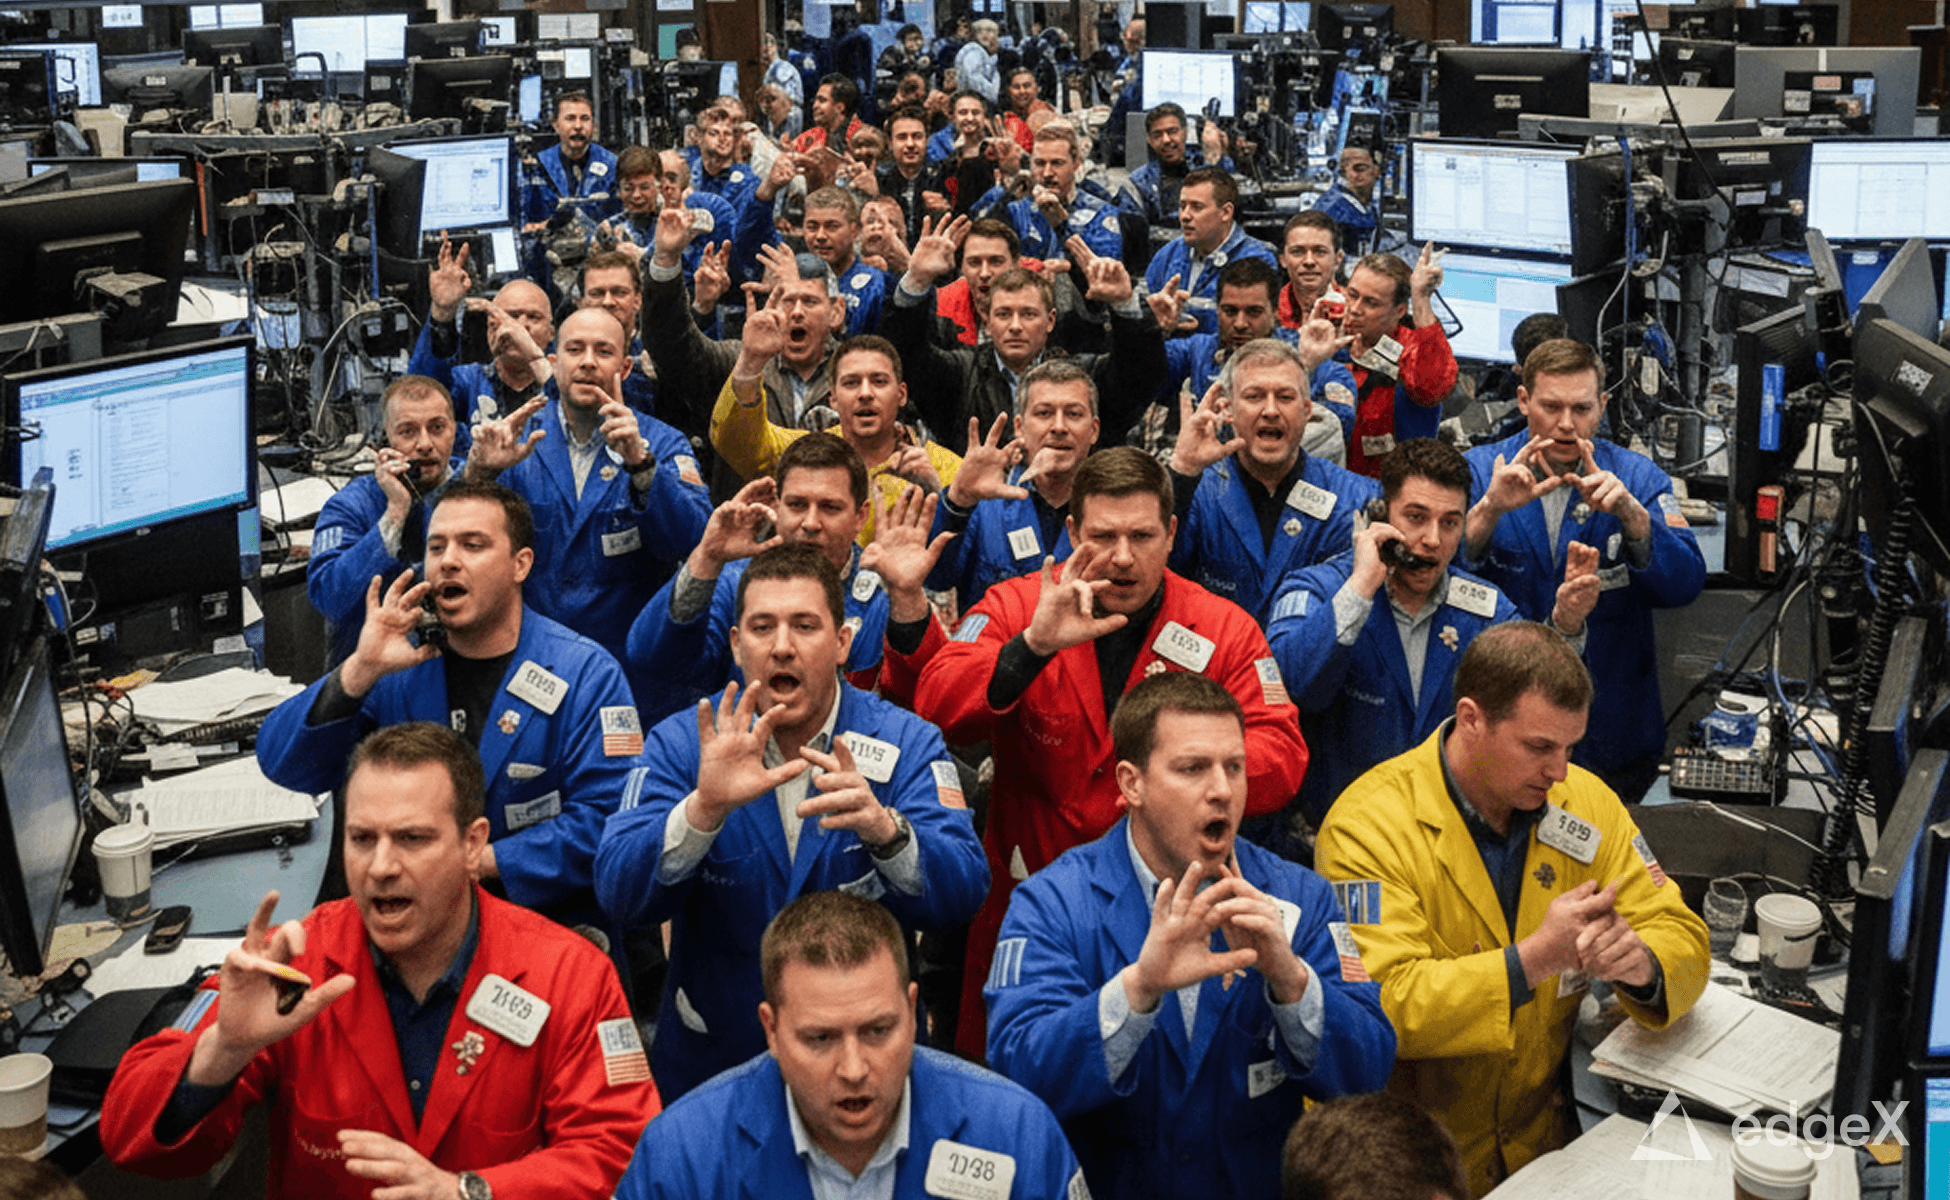
The S&P 500, Nasdaq Composite and Nasdaq 100 are bouncing higher, but buyers still have key technical levels to reclaim before they can take fuller control of the market, according to technical analysis published by ForexLive.
The previous session's selloff left the major US stock indices in a deep hole. The Nasdaq 100 plunged 6.36%, its biggest one-day decline since 2020, and the weakness spread well beyond the tech-heavy index. Along the way, the selling broke technical levels that buyers had leaned on for support. Those breaks matter now because some of the same levels that gave way on the descent have become the first hurdles on the climb back.
The major indices are finding their footing. The bounce is welcome, but there is still work to do before buyers can begin to wrestle back more control. The first test comes when the rebound reaches a level that broke in the selloff. If buyers can move above it and stay above it, the next upside target comes into focus. If the rally stalls and sellers defend that former support, the recent lows can come back into play.
How the Key Levels Stack Up
Here is how the technical picture shapes up for each of the three benchmarks. The markers in play are staples of chart analysis: the 200-day moving average is a widely followed gauge of long-term trend, while retracement levels such as the 38.2% and 50% thresholds measure how much of the prior move has been recovered. That is why reclaiming them is treated as a test of whether a rebound has staying power rather than a one-day pause in a selloff.
S&P 500: The decline stalled ahead of the 200-day moving average at 7325 and a swing area that extends down to 7300. If that support zone can hold, the upside target for buyers sits at 7507, followed by the 100-day moving average at 7619.
Nasdaq Composite: The recent low stalled within a swing area between 24206 and 24425. The index is trading above that zone but remains below the 200-day moving average at 25098 and the broken 38.2% retracement level at 25036. Moving above both is needed to strengthen the bullish bias.
Nasdaq 100: The index is rebounding, but the move back above the broken 50% retracement at 27103 is failing. For buyers to gain confidence — and to put pressure on the sellers — they need to get and stay above 27103.
Reading the Rebound
For traders weighing the bounce, the central questions are which levels would restore buyer confidence if reclaimed, where buyers can define tight risk if they step in, and what signals would indicate that sellers are taking control again.
Dips have often found buyers, but the climb back can take longer than the fall. After a day like the previous session, traders must sort through fundamental storylines, shifts in positioning and a change in the market's appetite for risk — all of which feed into the mix that drives price action.
In the meantime, the charts give traders something concrete to work with. A broken swing area or moving average can serve as a barometer for the bias. If buyers reclaim such a level and hold it on a pullback, they have a level to lean against and a target to aim for. If the level gives way again, it marks where the case for the rebound starts to weaken.
For now, buyers have taken the first step out of the hole. How they handle the levels that gave way in the selloff will indicate how much further the rebound can go.
Source: ForexLive

