S&P 500 Slump Erases $2 Trillion as Wall Street's Post-Election Rally Unwinds
Key Takeaways
- •The S&P 500 dropped 3.5% on Nov. 5 while the Nasdaq Composite lost 4.7% and the Dow fell 2.7%, unwinding the gains recorded after the midterm elections.
- •The Kobeissi Letter estimated the S&P 500 lost $2.2 trillion in market capitalization over 55 minutes, a figure reflecting valuation changes rather than realized investor losses.
- •AI-linked stocks drove much of the decline, with Nvidia falling 7.5%, Advanced Micro Devices dropping 14.6%, and CoreWeave sliding 12.1%.
- •Bitcoin retreated to about $76,077 during the sell-off, yet Bitcoin ETFs posted $74.6 million in net inflows on Nov. 4, with Fidelity's FBTC gaining $236.7 million while BlackRock's IBIT saw $201.2 million in withdrawals.
- •The October U.S. employment report, scheduled for release on Nov. 6 at 8:30 a.m. Eastern Time, is the next major catalyst for traders to watch.
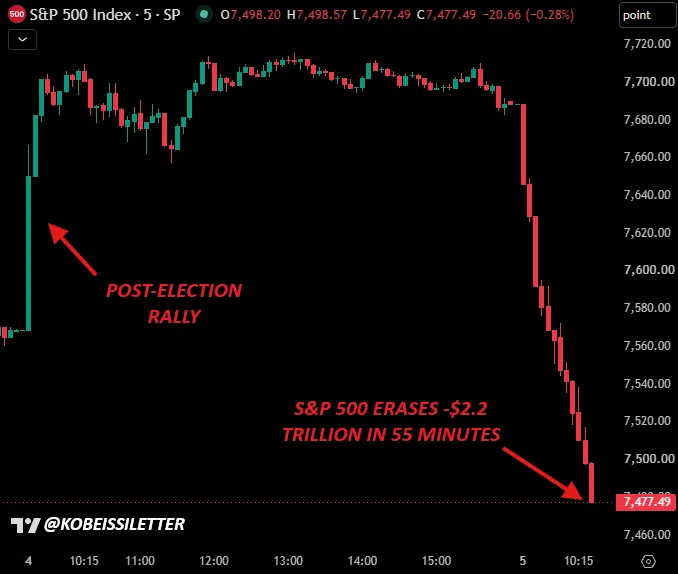
The S&P 500 sell-off accelerated on Nov. 5 as U.S. stocks reversed the advance that followed the midterm elections, unwinding the rally recorded immediately after the vote. The Kobeissi Letter estimated that the index lost $2 trillion in market value within 40 minutes. Technology shares led the retreat after Democrats won control of Congress, and the reversal extended beyond equities as Bitcoin price declines tracked weakness across risk assets.
Investors also weighed questions about artificial intelligence spending, financing costs, and future policy decisions. The election result coincided with these pressures but did not establish a single cause for the sell-off.
Post-Election Recovery Erased
The Kobeissi Letter wrote on X that the S&P 500 erased $2.2 trillion over 55 minutes, an estimate that placed Thursday's losses above Wednesday's post-election advance and underscored the speed of the reversal. These figures measured market capitalization, not realized investor losses.
Market data showed widespread weakness across U.S. stocks. Associated Press market coverage recorded an S&P 500 decline of 3.5% during Thursday's session, while the Dow Jones Industrial Average fell 2.7% and the Nasdaq Composite lost 4.7%. TradingView provides S&P 500 charts and market breadth data, and a capitalization-weighted index can fall sharply when its largest components decline together. As a result, technology selling weighed on the broader benchmark.
The U.S. midterm elections had initially supported a recovery on Wednesday. Midterm contests fall halfway through a president's term and decide every House seat along with roughly one-third of Senate seats, making the resulting chamber control a structural input into the policy environment investors price. Associated Press election coverage confirmed that Democrats secured majorities in the House and Senate. The subsequent Wall Street sell-off reversed that response, although the move did not prove the election triggered Thursday's decline.
Technology Stocks Deepen the Decline
Artificial intelligence-related shares accounted for a substantial share of the market pressure. Associated Press figures showed Nvidia stock falling 7.5%, while Advanced Micro Devices dropped 14.6%. CoreWeave declined 12.1% as investors reassessed borrowing costs and data-center investment plans. Tesla also faced selling pressure as technology stocks declined.
Higher financing costs can undermine the economics of capital-intensive infrastructure projects, a key consideration for data-center builders. Investors also considered possible restrictions on data-center development under the incoming congressional balance, although neither concern established that Democrats had enacted new restrictions on artificial intelligence activity.
The Nasdaq 100 and the broader technology sector faced pressure as chip-related losses spread. Still, a sharp decline in a single session does not automatically place an index in a bear market; that classification compares prices against a prior peak.
Political uncertainty complicated the outlook. Democratic congressional majorities could introduce tighter oversight or block elements of the administration's agenda. Investors nonetheless lacked a definitive policy announcement linking the election outcome to the immediate market losses.
Bitcoin Retreats Alongside Risk Assets
CoinMarketCap's Bitcoin market data showed the cryptocurrency near $76,077 during Thursday's sell-off, with a displayed 24-hour range of approximately $75,581 to $80,875. The move illustrated how quickly the previous session's rebound had reversed.
The BTC price decline followed weakness across technology shares, but correlation did not establish direct causation. Crypto assets trade continuously, while U.S. equities follow scheduled exchange sessions, a distinction that complicates intraday comparisons. CoinMarketCap also recorded approximately $45.22 billion in Bitcoin trading volume over 24 hours. That figure measured transactions, not investor withdrawals, so volume alone could not establish how much capital permanently exited cryptocurrency investments.
The decline increased attention on previous trading levels around $75,600 and the $80,000 recovery threshold. Neither level guaranteed support or resistance, however, and a sustained move through either area would provide clearer information about near-term direction.
Bitcoin ETF Flows Offer a Different Picture
Farside Investors' daily Bitcoin ETF figures showed $74.6 million in net inflows on Nov. 4, a contrast to the risk-asset weakness that followed the next day. Fidelity's FBTC attracted $236.7 million, while BlackRock's IBIT recorded $201.2 million in withdrawals, with other funds contributing smaller positive flows to the overall result.
The preceding three sessions had recorded net outflows, limiting the strength of Wednesday's recovery signal. The reported ETF subscriptions also preceded Thursday's equity sell-off, and no finalized Nov. 5 figure was available in the cited daily table at the time of review.
An ETF flow measures fund creations and redemptions rather than an instantaneous change in Bitcoin's market price, so positive daily subscriptions can coexist with a later decline in the underlying asset. The next completed session would clarify whether institutional fund demand held during Thursday's downturn.
Next Catalyst on the Calendar
The next scheduled U.S. catalyst was the October employment report on Nov. 6. Monthly employment reports are among the most closely watched U.S. economic releases, providing a timely read on hiring and labor market conditions that investors use to gauge the economy's trajectory. The Bureau of Labor Statistics scheduled its release for 8:30 a.m. Eastern Time, and traders could compare the data with updated equity prices, Bitcoin trading, and finalized ETF flows.
This article is for informational purposes only and does not constitute financial advice. Stock and cryptocurrency markets are volatile, and market projections carry financial risks.

