Solana (SOL) Breaks Above $90 as Short Squeeze Triggers Possible Bull Market Signal
Key Takeaways
- •Solana’s price rose nearly 25% in seven days and moved above $90 for the first time in months.
- •The rally followed the SEC’s proposal of a new regulatory framework for crypto assets.
- •Trading volume climbed nearly 50% to $9.5 billion, while more than $4.6 billion in short positions were liquidated over three days.
- •SOL broke above the 200-day EMA and prior resistance levels at $78 and $90, which had capped the price for months.
- •ETF net inflows tied to SOL reached $38 million, and the Crypto Fear and Greed Index jumped to 76, signaling stronger market sentiment.
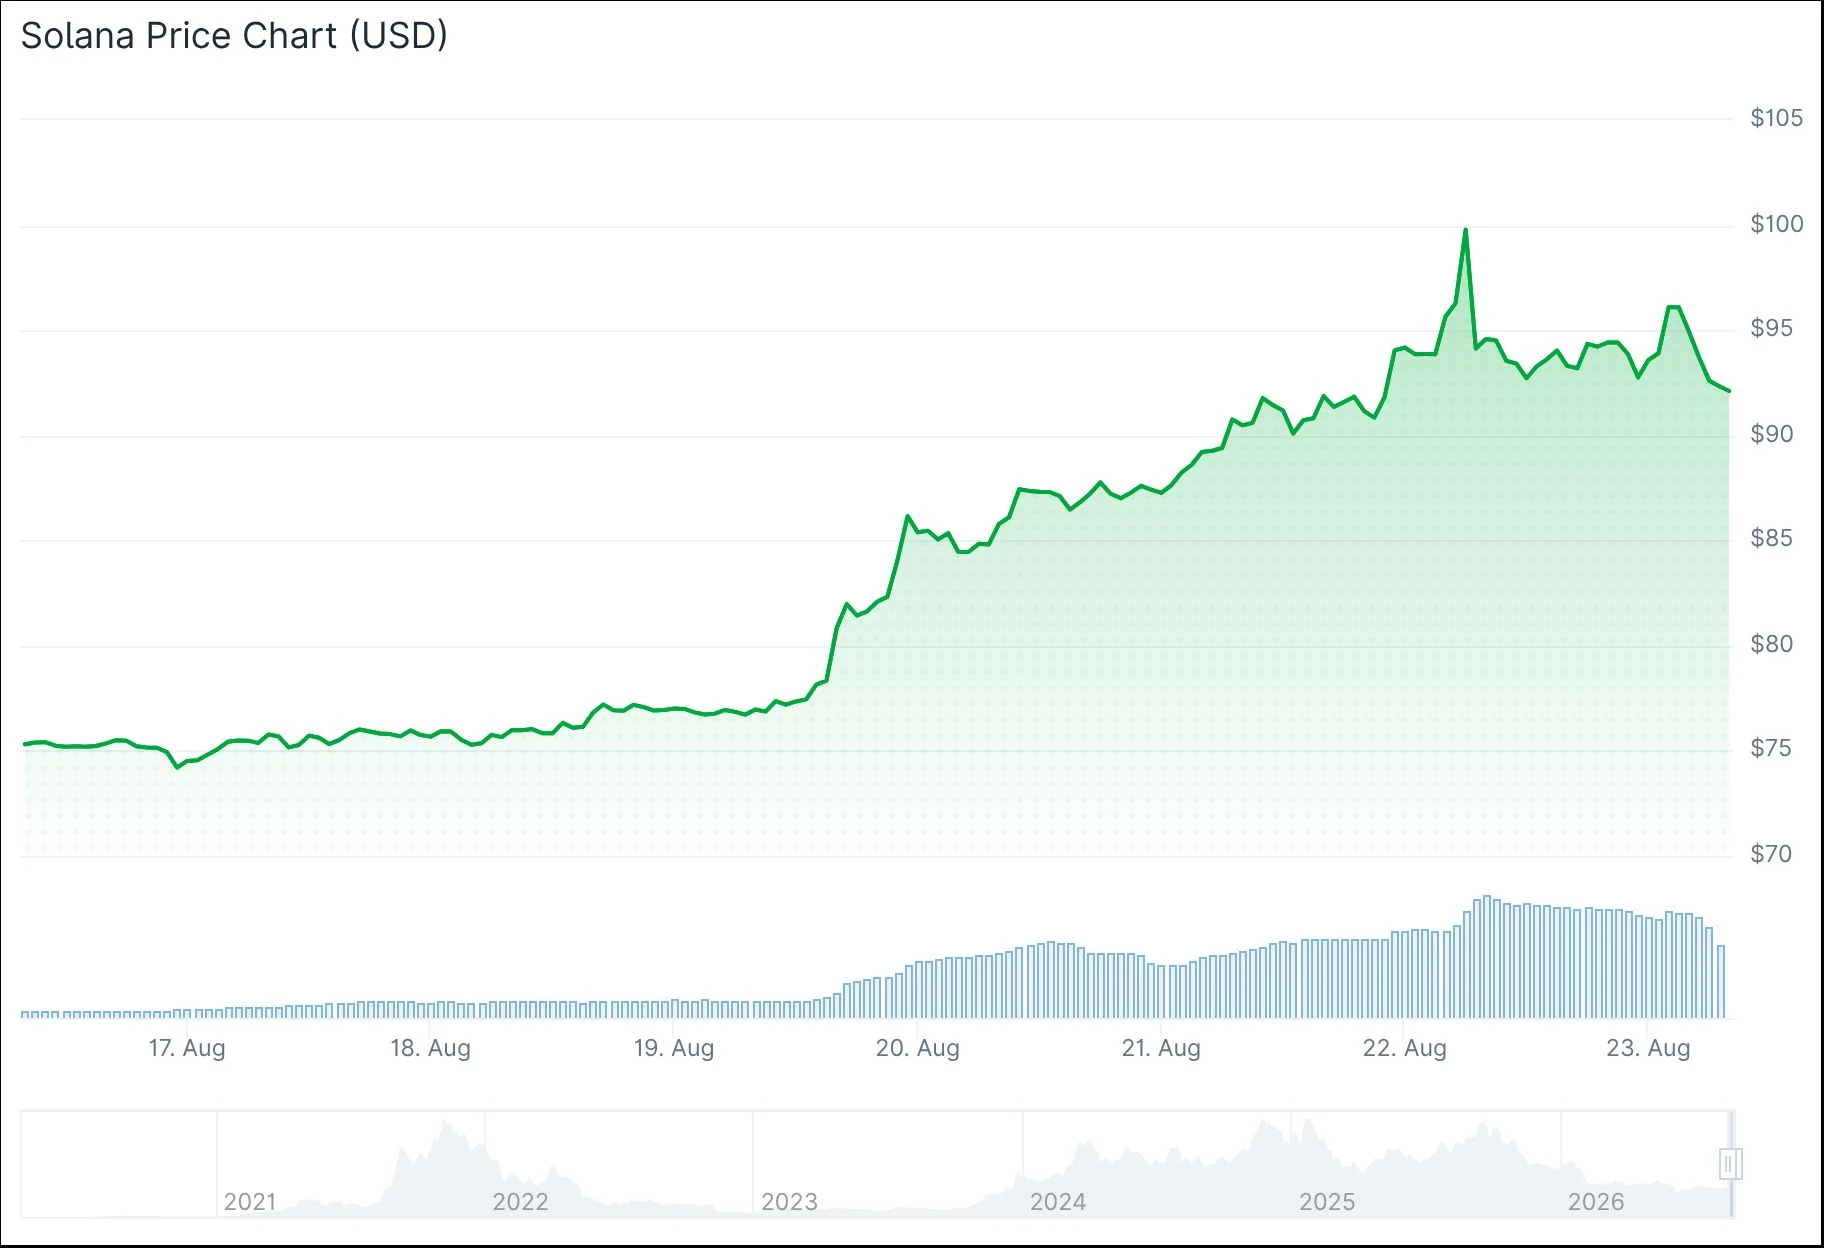
Solana (SOL) has climbed nearly 25% over the past seven days, pushing above the $90 price level for the first time in months. The advance followed the U.S. Securities and Exchange Commission's proposal of a new regulatory framework for crypto assets, which served as the catalyst for the breakout. The move is also a milestone for a token with a turbulent history: SOL is the native asset of Solana, a layer-1 blockchain launched in 2020 and designed for high throughput and low fees. It traded below $10 in late 2022 after the collapse of FTX, whose sister trading firm Alameda Research was a major SOL holder, and its regulatory standing has been under scrutiny since 2023, when the SEC alleged in lawsuits against the exchanges Coinbase and Binance that SOL was an unregistered security.
The rally has been accompanied by a sharp rise in trading activity. Volume surged by nearly 50% to $9.5 billion, equivalent to 17% of SOL's circulating market cap. The spike above key resistance levels triggered a cascade of short liquidations across the market, with more than $4.6 billion in short positions wiped out in just three days. As those positions were forcibly closed, the resulting buying pressure amplified the move — a dynamic widely known as a short squeeze. August 18 alone saw $2.9 billion in liquidations, the eighth-largest single-day wipeout in crypto market history.
On the charts, SOL broke above both the 200-day exponential moving average (EMA) — one of the most widely watched long-term trend indicators, with breaks above it often read by traders as a possible early bull-market signal — and two former supply zones at $78 and $90, ending months in which those levels acted as key resistance. On August 21, Solana closed at $93.72, up 6.94% on the day.
Financial news account The Kobeissi Letter marked the milestone on X:
BREAKING: Solana, $SOL, surges above $100 for the first time since February 3rd as the crypto rally gains momentum. pic.twitter.com/czVtnnGT2I
— The Kobeissi Letter (@KobeissiLetter), August 22, 2026 (post)
On-Chain Signal Returns
An on-chain indicator that previously preceded a major rally has reappeared. A crossover between the 30-day and 50-day moving averages for daily active users (DAUs) last triggered in June 2025; in the months that followed, SOL climbed roughly 70%, from $145 to $245. That same crossover has now shown up again on a chart from crypto analytics firm Santiment tracking Solana's daily active addresses, a metric that counts unique addresses transacting on the network each day.
ETF net inflows tied to SOL have reached $38 million, the highest positive reading since May. Net flow measures the balance between capital entering and leaving these funds over a given period, and the latest figure adds to the case that institutional interest is returning to the asset. Fund flows have become a closely watched barometer of institutional demand across crypto since U.S. spot bitcoin ETFs launched in January 2024 and attracted tens of billions of dollars in net inflows within their first year.
Broader market sentiment has shifted sharply as well. The Crypto Fear and Greed Index moved from around 36 (neutral) to 76 (greedy) within the week. The index aggregates market volatility, momentum, social-media activity and other signals into a single sentiment score, and it now sits firmly in greedy territory.
What Analysts Are Watching
The rapid price move has pushed the Relative Strength Index (RSI) — a momentum oscillator on a 0-to-100 scale where readings above 70 are conventionally read as overbought — into overbought territory, and a large upper wick on the day's candle indicates that selling pressure is building near current levels. Analysts are watching the $83 level as a potential pullback target if profit-taking accelerates; the 200-day EMA sits nearby and could act as support.
Prior to this week, SOL had tested $90 at least twice without holding it. Thursday's close above that level marked the first convincing settlement above $90 during this period.
If Solana holds above $90 in the coming sessions, the next technical reference point is the mid-$120s. If it fails, the pattern of lower highs — a classic signature of a downtrend — would remain intact.
The most recent data shows SOL trading at $91.89, down 9.15% on the day — an early indication that the pullback some analysts had flagged may already be underway. Even at that level, SOL remains above the $90 threshold that had capped its price action for months.

