Solana (SOL) Rallies Past $90 After $4.6 Billion Short Squeeze and Bullish On-Chain Signal
Key Takeaways
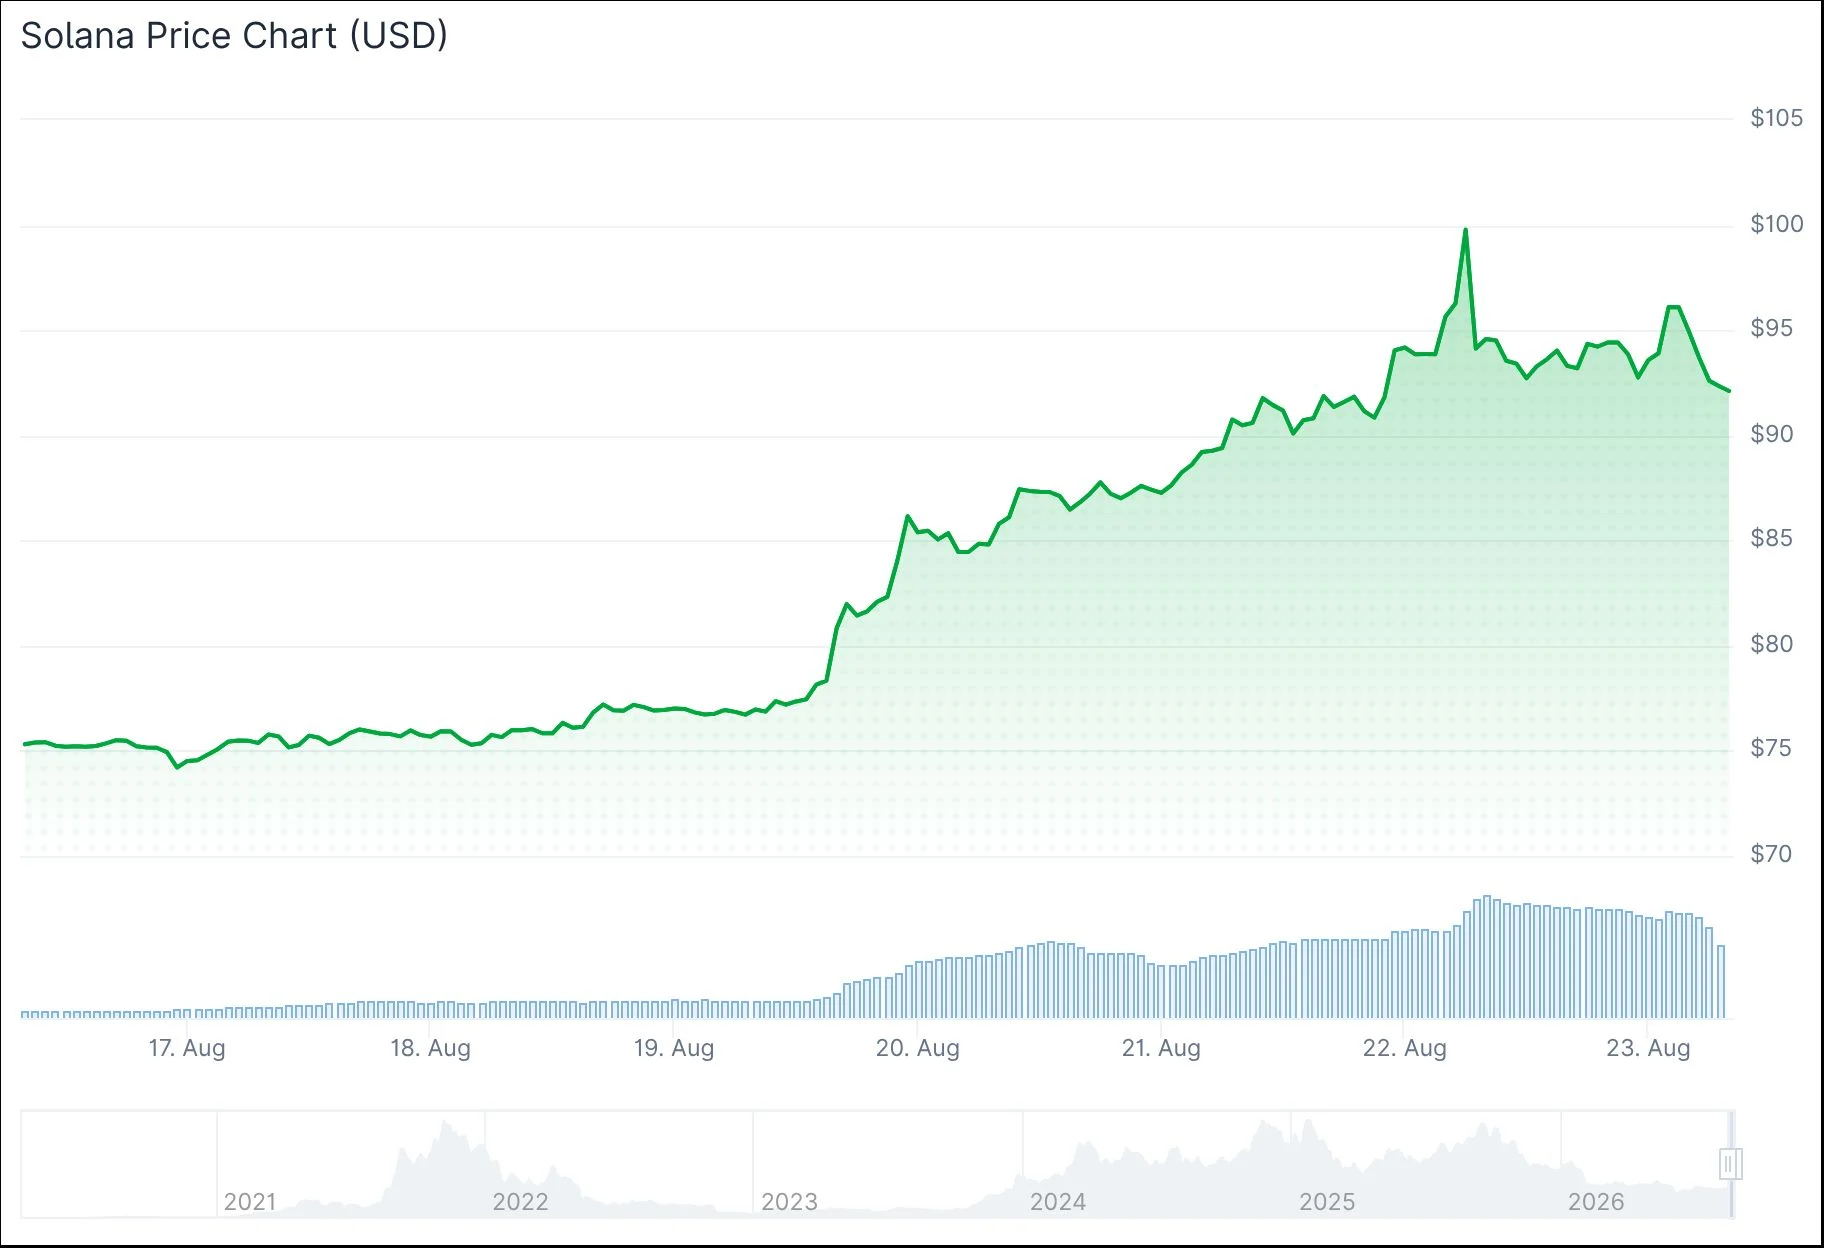
- •Solana gained roughly 25% in seven days and broke above the $90 level for the first time in several months.
- •More than $4.6 billion in bearish positions were liquidated across three days, with August 18 ranking as the eighth-largest single-day liquidation event in crypto history.
- •The Crypto Fear and Greed Index rose from 36 to 76, signaling a shift from neutral to greedy market sentiment.
- •ETF net inflows into SOL products reached $38 million, the strongest reading since May.
- •Technical analysts are monitoring $83 as a possible support level if Solana pulls back from its recent advance.
Key Highlights
- Solana (SOL) surged approximately 25% in one week, reaching the $90 milestone after the U.S. Securities and Exchange Commission (SEC) introduced a fresh cryptocurrency regulatory framework.
- More than $4.6 billion worth of short positions were liquidated across three days, with August 18 marking the 8th most significant single-day liquidation event in cryptocurrency market records.
- The Crypto Fear and Greed Index surged from 36 to 76, transforming market sentiment from neutral territory to greedy levels.
- A critical on-chain indicator — the crossover of the 30-day and 50-day moving averages tracking daily active users — previously catalyzed a 70% SOL price increase from $145 to $245.
- ETF net inflows climbed to $38 million, the strongest performance since May, while market observers monitor $83 as a key support zone for potential retracements.
Solana (SOL) has posted a remarkable surge of approximately 25% over the previous seven days, breaking through the $90 threshold for the first time in several months. The significant upward movement came in the wake of the SEC's unveiling of a proposed regulatory structure for digital assets. For Solana, the drive toward formal rulemaking carries particular weight: SEC lawsuits filed against major cryptocurrency exchanges in June 2023 listed SOL among the tokens alleged to be unregistered securities, and the agency moved to drop those cases in 2025. A codified framework would give the token's regulatory standing explicit grounding in rule rather than court outcomes.
Market activity intensified dramatically, with trading volume jumping nearly 50% to reach $9.5 billion — roughly 17% of SOL's total circulating market capitalization. The breakthrough above critical resistance thresholds set off a domino effect of forced short position closures across the cryptocurrency market, eliminating an extraordinary $4.6 billion in bearish positions in a span of merely three days. August 18 independently recorded $2.9 billion in liquidations, establishing itself as the 8th most substantial single-day liquidation occurrence in the entire history of cryptocurrency markets. Short squeezes feed on exactly this mechanic: as prices climb, leveraged traders betting on declines are compelled to buy back their positions, and those forced purchases push prices higher still, tripping further liquidations in a self-reinforcing cascade.
BREAKING: Solana, $SOL, surges above $100 for the first time since February 3rd as the crypto rally gains momentum. pic.twitter.com/czVtnnGT2I
— The Kobeissi Letter (@KobeissiLetter) August 22, 2026
SOL successfully penetrated both the 200-day exponential moving average (EMA) and two previously established supply zones positioned at $78 and $90 — price levels that had served as formidable resistance barriers for an extended period. On August 21, Solana concluded trading at $93.72, reflecting a daily gain of 6.94%. The Kobeissi Letter, a prominent financial analysis account, highlighted that SOL had climbed above $100 for the first time since February 3rd, characterizing the movement as evidence of accelerating crypto market momentum.
Critical On-Chain Indicator Resurfaces
A significant on-chain metric that historically preceded substantial price rallies has emerged once again. The intersection between the 30-day and 50-day moving averages measuring daily active users (DAUs) — a count of unique addresses transacting on the network that analysts treat as a proxy for real usage rather than pure price speculation — last occurred in June 2025, after which SOL experienced a dramatic climb from $145 to $245 within several months. This identical crossover pattern has now reappeared in Santiment's analytical data tracking Solana's daily active addresses.
Net inflows into SOL-related ETF products have reached $38 million — the strongest positive measurement recorded since May — strengthening the argument that institutional capital is flowing back into the asset. Spot Solana ETFs began trading in the United States only in mid-2025, so fund-flow data is a comparatively new demand gauge for the token, and one that also lets traditional brokerage accounts obtain SOL exposure without holding the underlying asset. Market psychology has likewise undergone a dramatic transformation: the Crypto Fear and Greed Index, a composite that weighs price volatility, trading volume, social-media activity, and market dominance, moved from approximately 36 (neutral sentiment) to 76 (greedy sentiment) over the course of the week.
Technical Levels Under Market Scrutiny
The RSI indicator has advanced into overbought conditions — readings above 70 on the 0–100 scale are conventionally treated as overbought — following the sharp price appreciation, and a substantial upper wick visible on the current candle indicates mounting selling pressure around present price levels. Technical analysts are closely monitoring the $83 price level as a probable retracement target should profit-taking intensify; the 200-day EMA is positioned in close proximity and could function as a support mechanism.
Before this week's breakout, SOL had challenged the $90 level on at least two separate occasions without successfully maintaining it. Thursday's closing price above this threshold represents the first decisive settlement beyond $90 throughout this timeframe. Should Solana maintain its position above $90 during upcoming trading sessions, the subsequent technical target zone emerges around the mid-$120s; a failure to hold this level would preserve the existing pattern of declining peaks.
Current market data indicates SOL trading at $91.89, reflecting a 9.15% daily decline — an early sign that the anticipated pullback may already be materializing.
Source: Blockonomi

