Solana’s RWA and Payments Growth Remains Concentrated Across Trading, Issuers and Infrastructure
Key Takeaways
- •Solana processed $14.7 billion of the $46 billion in RWA spot volume tracked by Allium, representing 32% of dollar volume and 47% of transactions.
- •Solana’s RWA activity was driven by frequent, smaller trades, with a $29 median transaction and 114 trades per trader compared with $70 and 63 elsewhere.
- •xStocks generated 60.8% of Solana’s 30-day tokenized-stock DEX volume, while Raydium’s concentrated-liquidity pools handled 69.4%.
- •Solana ranked first in reported x402 transaction count and volume for a second consecutive week, although Artemis previously estimated that 86% of historical x402 payments were gamed or non-economic.
- •Frankfurt and Amsterdam together accounted for 54.7% of Solana leader slots, exposing infrastructure to correlated regional connectivity and hosting risks.
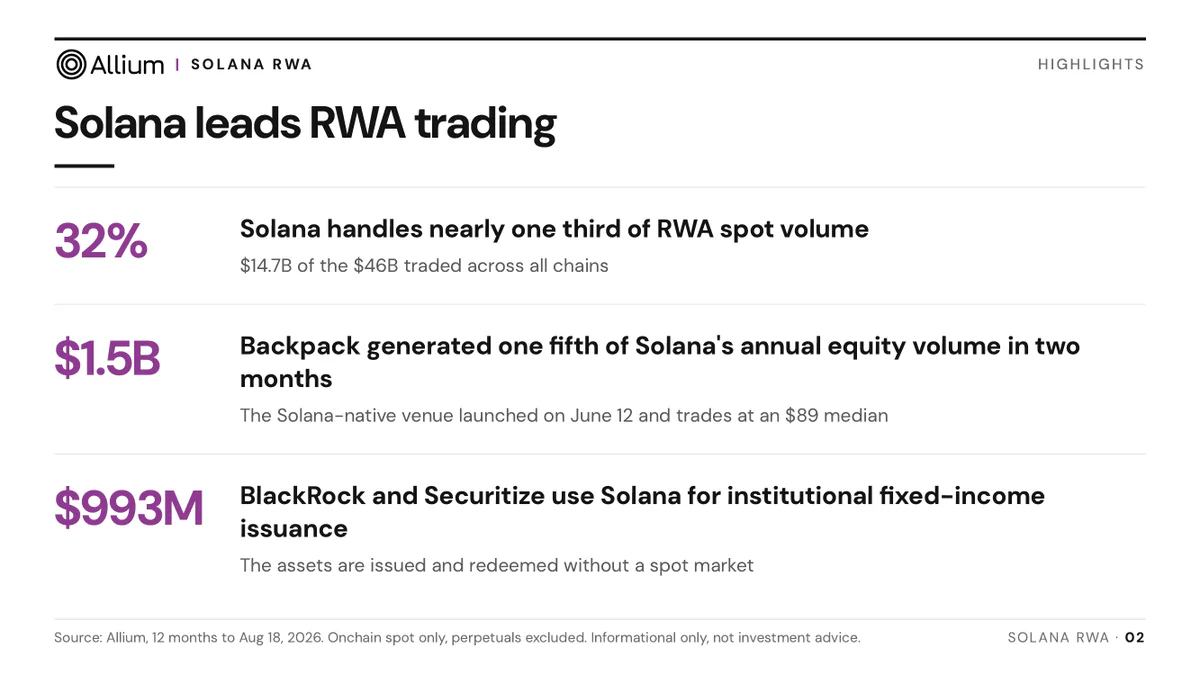
Solana processed 32% of real-world asset (RWA) spot volume over the 12 months through August 18, 2026, but held only 12% of the outstanding RWA value measured across the networks studied by Allium.
According to Allium’s report, Solana handled $14.7 billion of the $46 billion in onchain RWA spot volume recorded across 24 chains. The network represented 32% of dollar volume and 47% of transaction count.
The difference between Solana’s trading share and its share of outstanding value indicates that its lead was driven more by turnover than by the amount of tokenized assets held on the network. Allium attributed part of the gap to frequent, relatively small transactions. The median RWA trade on Solana was $29, compared with $70 on other networks. Its 374,000 traders completed an average of 114 trades each, versus 63 elsewhere.
Tokenized equities accounted for $8.2 billion of Solana’s annual RWA volume. Allium found that 63% of those trades took place outside U.S. exchange hours, indicating that a substantial portion of the activity occurred while traditional markets were closed.
The annual data also showed concentration within specific asset classes. Solana processed $5.4 billion, or 74%, of the fixed-income volume measured across the networks. However, almost all of that share came from two private-credit issuers. In the private-fund category, a single reinsurance product generated 52% of the onchain volume measured by Allium.
Different datasets show different market shares
A separate dataset from Token Terminal placed Solana’s tokenized-stock decentralized exchange (DEX) volume at $807.3 million over the latest 30 days. That represented 9.1% of the $8.8 billion recorded across six chains.
The figures were published in a post by Token Terminal on X:
Solana accounted for $807.3M, or 9.1%, of tokenized stock DEX volume over the past 30d
Within Solana, the leaders were:
Reference stock: ETF ($165.3M)
Asset: SPYx ($145.4M)
Issuer: xStocks ($490.7M)
Venue: Raydium CLMM ($560.4M)
— Token Terminal 📊 (@tokenterminal) September 9, 2026
The 9.1% figure does not conflict with Allium’s 32% share. Allium examined six RWA classes over a 12-month period, including equities, fixed income, private funds and commodities. Token Terminal measured only tokenized stocks traded through DEXs during a single month. The reporting windows therefore ranged from 30 days to the 12 months ending August 18, 2026.
One issuer and one venue account for much of Solana’s stock volume
Within Solana, xStocks generated $490.7 million, or 60.8%, of the 30-day tokenized-stock DEX volume. Raydium’s concentrated-liquidity pools handled $560.4 million, equivalent to 69.4% of the total.
Those percentages cannot be added together because they describe different layers of the market. xStocks is an issuer, while Raydium is a trading venue.
Changes to xStocks listings, redemption terms or incentives could reduce the products available for trading. At Raydium, a contract incident or the departure of major liquidity providers could reduce liquidity and widen spreads.
The data indicate commercial concentration rather than a consensus failure. Trading volume could decline or migrate quickly after a significant change involving either xStocks or Raydium.
x402 adds a payments use case
Beyond tokenized stocks, Solana is competing to settle payments for application programming interfaces (APIs) and other online services through x402.
x402 documentation describes the system as an open protocol that allows an API or digital service to request a stablecoin payment within an HTTP request. A person, application or software agent can pay for data, computing resources or other online services without completing a conventional checkout process.
Solana ranked first in x402 transaction count and volume for a second consecutive week, according to an Artemis chart shared by Solana on X.
Unlike the RWA comparisons above, x402 activity is reported through payment transaction counts and volume rather than outstanding tokenized-asset value. The two datasets therefore describe different forms of network use and should not be combined into a single adoption measure.
Because x402 payments settle in stablecoins, they do not represent direct purchases of SOL. Their connection to Solana’s native token is mainly through the blockspace and transaction fees used to process them.
Transaction counts require additional scrutiny. In January 2026, Artemis estimated that 86% of Solana’s historical x402 payments were gamed or non-economic under its revised methodology. Earlier figures had been inflated by memecoin transfers and attempts to climb activity rankings.
That estimate applied to earlier data. The September ranking therefore indicates a current lead in reported activity, but does not by itself establish a mature commercial market. Recurring buyers, qualified sellers and sustained payment value would provide stronger evidence of organic use than another weekly transaction record. Those measures could help distinguish payments for useful services from testing, farming and leaderboard competition.
Frankfurt and Amsterdam account for more than half of leader slots
A separate concentration appears in the validator infrastructure processing Solana transactions. A Glassnode post on X placed 35.3% of Solana’s leader slots in Frankfurt and 19.4% in Amsterdam during epoch 1030. Together, the two cities accounted for approximately 54.7% of leader slots.
Glassnode also reported that 310 of 675 validators were located in the two cities. That represented 46% of the validator count and 53% of active stake. Europe accounted for 72.9% of leader slots in the same snapshot.
Leader-slot share measures where scheduled block-production opportunities are located, not who controls the validators. Independent operators can use infrastructure in the same city, so the figures do not establish common ownership. They do, however, show correlated exposure to connectivity failures, hosting disruptions and regional regulatory action.
The distribution can change between epochs as validators move, leave the network or receive different amounts of delegated stake. The figures describe the September 8 snapshot, not a permanent allocation of block production.
Connectivity incentives help explain the geographic clustering
Frankfurt and Amsterdam are major connectivity hubs, making them attractive locations for validators and latency-sensitive traders. Physical proximity reduces the time needed to send transactions to the current block producer, which can improve execution for market makers, arbitrage systems and liquidation bots.
Competition for lower latency can encourage operators to use the same well-connected infrastructure. Maintaining such a setup also carries hosting, connectivity and hardware costs. Changes to validator rewards can therefore affect which operators can justify running infrastructure in major connectivity hubs.
Coindoo previously examined how record Solana fees coincided with proposed reductions in validator rewards in a separate article. The current geographic data do not show whether those proposals contributed to the Frankfurt-Amsterdam cluster.
For tokenized stocks, concentration would decline if competing issuers and venues gained volume without reducing the overall market. A lower xStocks or Raydium share caused only by reduced trading would not demonstrate broader adoption.
At the infrastructure level, the clearest sign of wider distribution would be growth in stake and leader-slot share outside Frankfurt and Amsterdam. A lower concentration resulting from expansion elsewhere would strengthen distribution, while a lower share caused by validators leaving would not.
This article is for informational purposes only and does not constitute financial advice.
Source: https://coindoo.com/solana-rwa-payments-frowth-concetration-problem/
