Solana Price Holds Near $75 Breakout Level as Momentum Indicators Turn Constructive
Key Takeaways
- •Solana broke through a descending trendline dating back to May, shifting the daily market structure and turning the $75 area into a key near-term support level.
- •The weekly RSI shows bullish divergence with a higher low while price recorded a lower low, indicating that bearish momentum weakened during the recent decline.
- •The daily MACD line crossed above its signal line with the histogram moving into positive territory, signaling that recent downside momentum has subsided.
- •Solana's next major resistance levels are near $80 and $85, where previous recovery attempts encountered selling pressure.
- •Solana has traded within a wide consolidation range between the mid-$60s and levels below $100 throughout 2025 after falling from its yearly highs.
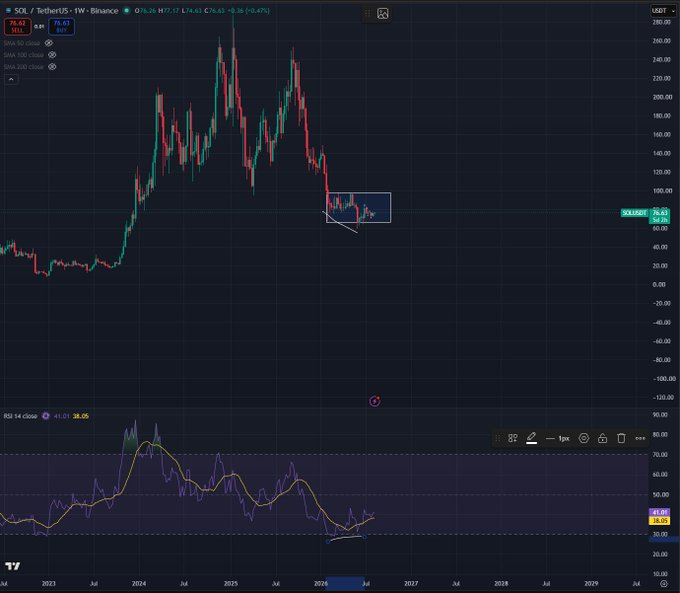
Solana (SOL) traded near $75.65 after reclaiming the $75 breakout level, restoring the short-term recovery structure after the token briefly slipped below that zone. Buyers now need to maintain SOL above $75 to preserve the breakout, while weekly RSI divergence and an improving daily MACD continue to underpin the recovery setup.
The next resistance sits near $80, followed by $85. A sustained move above those levels would strengthen the case for a broader trend reversal, though Solana still requires stronger buying activity before traders can confirm another sustained advance.
Trendline Breakout Shifts Daily Structure
SOL recently moved through a descending trendline that had capped several recovery attempts since May. The breakout shifted the daily structure and turned the $75 area into a key near-term support level. Buyers now need to defend that region during any pullback, as holding above $75 would preserve the current recovery framework and keep higher resistance levels in focus.
Solana, one of the largest Layer-1 blockchain networks by market capitalization, has seen its token trade within a wide range throughout 2025 as the broader cryptocurrency market navigated shifting sentiment. The trendline dating back to May reflects a multi-month correction phase that the current breakout attempt seeks to reverse.
The first major resistance sits near $80, where previous recovery attempts faced selling pressure. A sustained move through $80 could open a path toward $85, a level that also aligns with previous swing points on the daily chart. A return below $75, however, would weaken the breakout and place lower support back in focus.
Weekly RSI Divergence Signals Weaker Selling Pressure
Solana's weekly chart shows a bullish divergence between price and the Relative Strength Index. SOL recently formed a lower price low while the RSI recorded a higher low, indicating that bearish momentum weakened during the recent decline. The RSI has since climbed toward 41 after moving close to the oversold region near 30.
The broader weekly structure still keeps Solana inside a wide consolidation range. Price has traded mainly between the mid-$60s and levels below $100 after falling from its 2025 highs. The mid-$60 area now serves as an important lower support zone, and a break below that region could expose SOL to another period of selling.
The current divergence does not confirm a full trend reversal on its own. Solana still needs stronger price action before the weekly setup develops into a wider recovery. A move toward the $90 to $100 region would place price near the upper section of the current range, where buyers would then face another major resistance test.
MACD Turns Higher After Daily Trendline Break
Solana's daily MACD has also started showing stronger momentum. The MACD line crossed above its signal line, while the histogram moved into positive territory, signaling that recent downside momentum has weakened. Buyers have gained some short-term control after SOL moved above the descending resistance line.
Both MACD lines still sit close to the zero level, which keeps the signal in an early stage. Further price gains could reinforce the shift in momentum. SOL also needs to hold its breakout area during any pullback, as a move below $75 would weaken the current daily setup and put lower support levels back into focus.
Support between $72 and $73 provides another level that traders may watch. Solana has built rising support around that region during its recent recovery attempt. A deeper decline below this structure could return SOL beneath the former descending trendline, reducing the strength of the current breakout.
The $80 level now represents Solana's first major upside test after the trendline breakout. SOL faced resistance around this area during previous recovery attempts. Beyond the immediate technical levels, sustained improvements in network activity and decentralized exchange volume on Solana could factor into whether the current momentum setup attracts broader trader interest.

