Solana Falls Nearly 4x Harder Than Bitcoin in October as US ETF Outflows Mount
Key Takeaways
- •Solana activated its Alpenglow upgrade on Wednesday, replacing the TowerBFT consensus mechanism used since 2020 and reportedly reducing transaction finality from about 12.8 seconds to roughly 150 milliseconds, though the figure still awaits independent measurement.
- •US spot Solana ETFs saw $30.3 million in net outflows across the five trading days October 22, including about $8.5 million on October 22 alone, with net inflows appearing on just two October days.
- •A 24-hour CoinGlass snapshot recorded $816 million in crypto futures liquidations across 196,239 traders, with 84% of forced closures hitting long positions as Bitcoin slid toward $80,000.
- •SOL has dropped about 15% from its October open near $118, nearly four times Bitcoin's roughly 4% decline over the same period.
- •The $100 level, which coincides with the 0.382 Fibonacci retracement of SOL's move from about $60 to $125, was traded through for the first time on Saturday, putting the focus on whether the daily close holds.
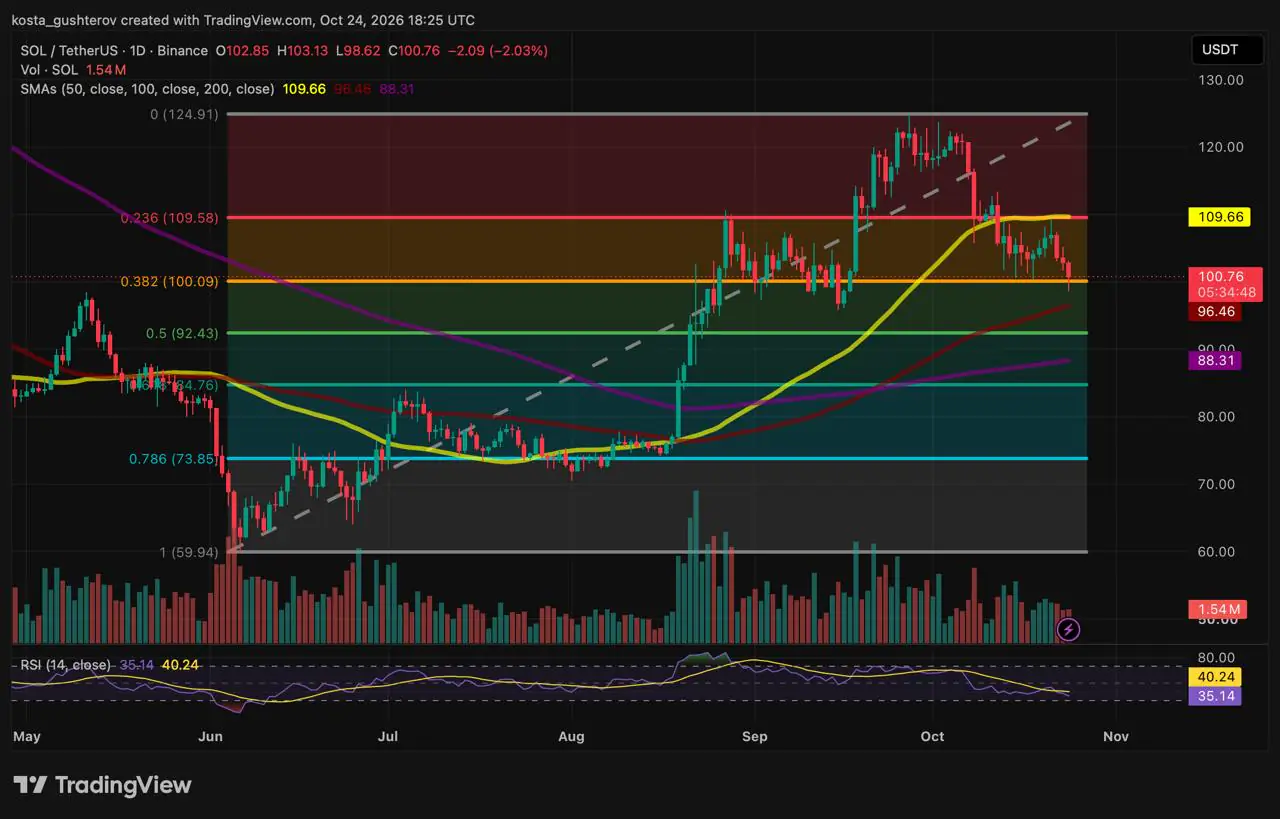
Solana's SOL is changing hands near $100.8, roughly 19% below its swing high, after a month in which the token has dropped about 15% — nearly four times Bitcoin's decline of roughly 4% — according to Binance's SOL/USDT daily chart on TradingView, with the daily candle still open.
Alpenglow Launch Met Resistance
Solana switched on its Alpenglow upgrade on Wednesday, replacing TowerBFT, the consensus system the network had run since 2020. Solana's official account on X said finality “just went from ~12.8 seconds to ~150ms.” According to Anza, the engineering firm behind the upgrade, the change means a transaction becomes irreversible in a fraction of a second instead of several seconds — a distinction that matters for exchanges crediting deposits and merchants taking payments. The 150ms figure still awaits independent measurement.
The token did not get the same lift. SOL rallied to about $109 on upgrade day, straight into its main resistance cluster, and gave the move back with a drop of about 5% the next session.
Where the Selling Came From
Two forces have worked against SOL since then: one specific to Solana, the other hitting the whole market.
Fund flows: SoSoValue data shows $30.3 million net out of US spot Solana ETFs in the five trading days to October 22, including about $8.5 million out on October 22 alone — a session in which no fund took in money. Net inflows have appeared on just two October days through October 22. These figures carry weight beyond their dollar size because spot ETFs hold the underlying token, so creations and redemptions translate into actual buying or selling of SOL, making the daily tally a running gauge of demand arriving through US-listed funds.
Leverage: a 24-hour CoinGlass snapshot recorded $816 million in crypto futures liquidated market-wide, with 196,239 traders wiped out and 84% of the liquidations hitting long positions. Liquidations are the automatic, forced closure of leveraged positions once losses exhaust a trader's margin, so the long-heavy split means most of the cascade came from traders positioned for higher prices. The largest single liquidation was an $11.85 million Ether position on Binance. Most of the liquidations struck in the final 12 hours of that window, as Bitcoin slid toward $80,000.
On their own, the numbers do not say whether SOL has a problem of its own or is simply caught in a falling market. The October scorecard does. SOL is down about 15% from its October open near $118, while Bitcoin, trading near $80,500 on Saturday, has lost roughly 4% over the same stretch. The market-wide flush explains the timing of Saturday's drop. It does not explain why SOL has fallen nearly four times as far as Bitcoin this month, and the steady drain from the ETFs is the clearest Solana-specific reason.
Three Tests of $100
The round number carries extra weight because it also sits on the 0.382 Fibonacci retracement of SOL's move from about $60 to $125 — one of the fixed ratios of a prior move that chart watchers treat as potential support or resistance. The first two tests held on a closing basis. Saturday's was the first to trade through the level, which makes the daily close the number to watch.
Levels Above and Below $100
The 50-day simple moving average, a common yardstick for the medium-term trend, supported SOL through September and early October before rolling over, and it now caps rallies alongside the 0.236 Fib. Below $100, there is a gap of about 4% before the next support, so a clean break would leave little to slow a move until the 100-day SMA. The 100- and 200-day averages are both still rising, which keeps the long-term trend pointing up.
The Case for Each Side
Bulls can argue that Saturday's break came in the middle of a market-wide liquidation wave, the kind of forced selling that can fade once leveraged positions are cleared. Bears can point to the size of the ETF drain. The $30.3 million that left in five trading days equals about 2% of the roughly $1.53 billion the US Solana funds hold — a steady withdrawal of the kind of patient demand that usually turns a relief bounce into a recovery.
Potential Moves (Not a Forecast)
SOL is clinging to $100, with the $109.6 resistance cluster overhead and the $92.4–$96.5 zone below.
- If $100 holds: A daily close back above $105, roughly halfway to resistance, could set up a retest of the 50-day SMA and 0.236 Fib.
- If $100 gives way: A daily close below it before the end of October could open a slide toward the 100-day SMA and 0.5 Fib.
- Bigger picture: The 200-day SMA sits just above the golden pocket. Holding it would keep the long-term structure intact, while losing it would put the golden pocket in play.
Method: daily SOL/USDT candles from Binance on TradingView, with the latest candle still open. Fibonacci levels run from the recent swing low to the swing high. Liquidation figures are a CoinGlass snapshot from Saturday evening. October performance is measured from each coin's approximate monthly open.
This article is provided for informational purposes only and does not constitute financial advice. Cryptocurrency prices are volatile.
Source: Coindoo

