Solana Price Slides to $79 as the Next Support Floor Comes Into Focus
Key Takeaways
- •Solana fell 2.63% to $79.57 on Friday after touching an intraday low of $77.92, leaving the token 36% below its October peak of $124.80.
- •The token has broken successive Fibonacci retracement levels from its June-to-October rally, with the 0.618 near $84.72 failing within a day of Tuesday's inflation data.
- •The next marked downside levels are the $76.03 extension and the 0.786 retracement near $73.82, a range Solana occupied from July until mid-August.
- •Overhead resistance is stacked at $84.72, the 200-day average at $88.98, and the 100-day and 50-day averages between $99.89 and $103.98, with a return to the highest layer requiring a rally of more than 25%.
- •Solana has declined further and faster than Bitcoin or ether and recent support levels produced no bounce, so rallies are treated as selling opportunities until a daily close above $84.72.
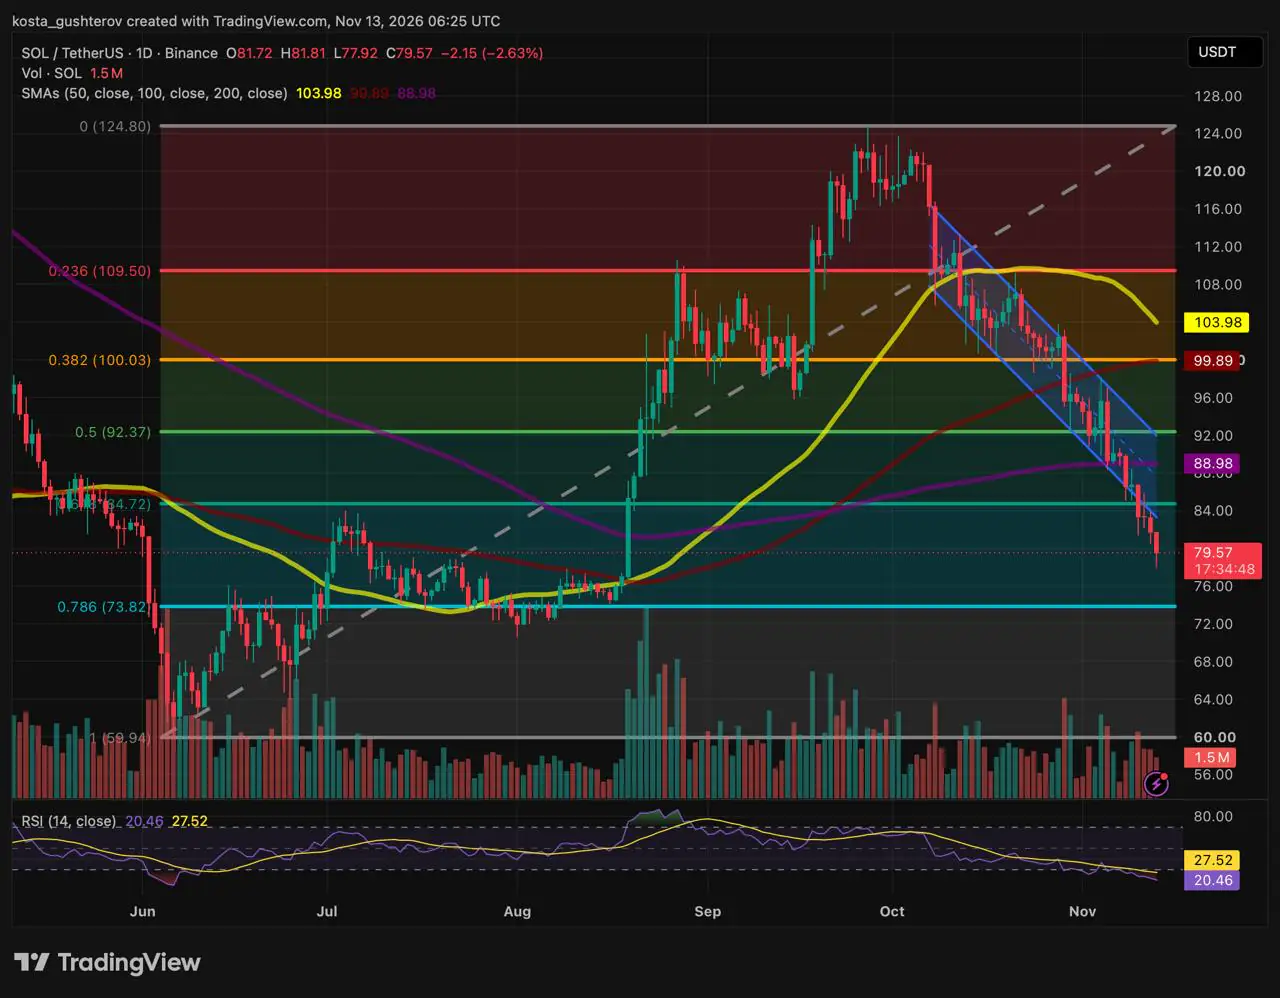
Solana (SOL) fell 2.63% to $79.57 on Friday, touching an intraday low of $77.92. The token now trades 10.6% below its 200-day simple moving average at $88.98—a long-term trend gauge many traders treat as the dividing line between bullish and bearish conditions—and sits 36% beneath its October peak of $124.80. All figures in this report are drawn from the Binance daily chart as of 06:25 UTC on Friday.
The latest leg lower has traded through two levels flagged in Coindoo's November 10 update. That report had SOL at $82, naming $81.34 as the last support inside its two-week range and $78.68 as the first level beneath it. Both have now traded.
Five Weeks, Four Levels
Solana's decline from $124.80 has followed a distinct rhythm. The markers are Fibonacci retracements—fixed ratios of the June-to-October advance that chartists commonly watch for potential pauses during a pullback. The 0.236 retracement near $109.50 gave way in the first half of October. The 0.382 near $100.03 broke at the start of November, taking the $100 mark and the 100-day average with it. The 200-day average followed on November 8, by which time the 0.5 near $92.37 had also been lost. The 0.618 near $84.72 lasted less than a day once Tuesday's inflation print hit. Each level has held for less time than the one above it.
Friday's candle opened at $81.72, reached no higher than $81.81 and fell to $77.92 before settling at $79.57 with 17 hours left in the session. That low sits beneath the $78.68 extension named in the previous update as the first stop under $81.34, leaving the $76.03 extension and then the daily 0.786 near $73.82 as the only marked levels before the retracement grid runs out at $59.94. Because the session was still open when the figures were drawn, Friday's final close will fix where the day officially lands against those marks.
What $73.82 Represents
A break at the 0.786 means Solana would have given back more than three quarters of its June-to-October rally. On the chart, it is also roughly where SOL spent July and the first half of August, a range between the low $70s and the high $70s that it did not leave until mid-August. A return there would place price back among holders who bought before the autumn run existed, which is usually where selling slows, if not where it stops.
The level lies 7.2% below the current price. The 200-day average, the first level that would have to be recovered to change the trend reading, is 11.8% above it. Downside to the next support is therefore smaller than the distance back to the first meaningful resistance, and that asymmetry is the clearest description of where SOL stands.
Three Layers of Ceiling
Everything above price is now resistance, arranged in layers. The first is the 0.618 near $84.72, which acted as support on Monday and formed the lower boundary of the descending channel SOL exited on Tuesday. The second is the 200-day average at $88.98, sitting just under the 0.5 near $92.37. The third is the pair at $99.89 and $103.98, the 100-day and 50-day averages, with the 0.382 near $100.03 between them and the 50-day now turning down.
SOL has lost 36% from its peak in five weeks; a return to that third layer would require a rally of more than 25%.
Why the Bounce Case Looks Weaker
The relief case deserves more scepticism here than usual. Solana has fallen further and faster than Bitcoin or ether—the two largest cryptocurrencies by market value—it sits deeper below its 200-day average than either, and the last two levels that should have produced a bounce, $84.72 on Monday and $81.34 on Tuesday, produced none.
A rebound toward $89 is possible from any oversold reading, and the market has produced several such readings this week without one arriving. Until SOL closes a day above $84.72, the working assumption is that rallies represent selling opportunities for holders still positioned from higher levels, and that the next level that matters is the one below.
This article is for informational purposes only and is not financial or investment advice. The levels and scenarios described are based on technical analysis of public chart data and do not guarantee future price movements. Cryptocurrencies are volatile, so do your own research before making any trading or investment decision.
This article is based on reporting originally published by Coindoo.

