Solana (SOL) Bulls Defend 200-Day Average as Crypto Market Selloff Deepens
Key Takeaways
- •Solana traded at $90.08 on November 6 within a daily range of $89.43 to $91.33, briefly slipping below $90 during a market-wide cryptocurrency sell-off that took Bitcoin to roughly $74,800, its lowest since August 21.
- •The Nasdaq Composite fell 5.52% on Thursday, erasing as much as $2.5 trillion in market value, as investors reassessed AI infrastructure spending and pulled digital assets lower in tandem with equities.
- •The October U.S. jobs report showed 165,000 new positions against a 65,000 forecast, lifting market expectations for a 25 basis point Federal Reserve rate hike in December to a new high of 80% and pushing the 10-year Treasury yield up 6.4 basis points to 4.894%.
- •Crypto liquidations exceeded $1 billion early in the sell-off before easing to roughly $707 million over a 24-hour window, while the Crypto Fear and Greed Index slipped to 31, within the fear range.
- •SOL traded just above its 200-day simple moving average of $89.04 with an RSI of 32.4, leaving it down nearly 70% from its January 18, 2025 all-time high of $294.85, with support at $88.30 and resistance at $95.
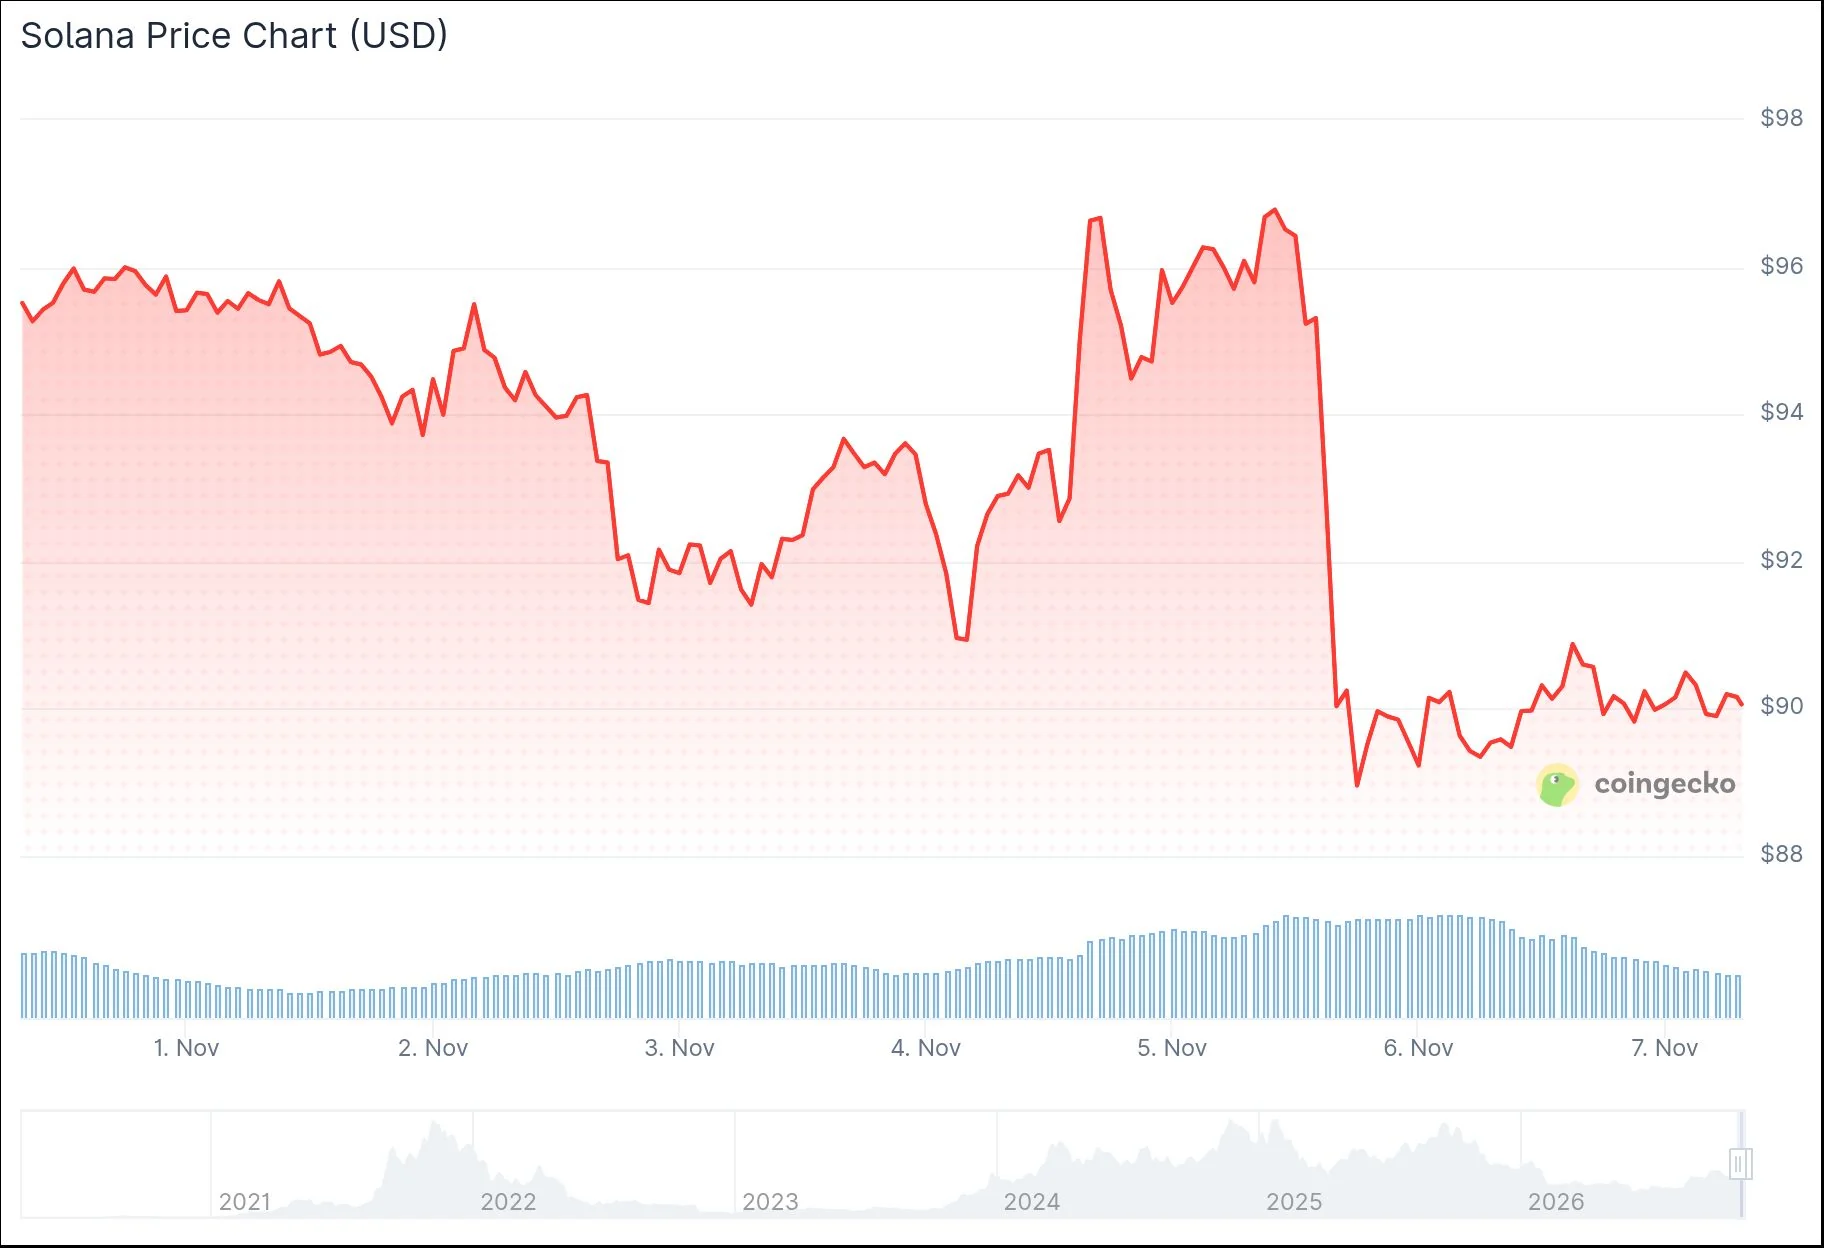
Solana (SOL) traded near $90 on Friday, November 6, after briefly slipping below that level during a broad cryptocurrency market sell-off. Data from Fool.com showed the token changing hands at $90.08, with a daily trading range of $89.43 to $91.33.
The weakness extended across the broader digital asset market. Bitcoin touched about $74,800, its lowest point since August 21, while Ethereum traded at $2,231 and XRP stood at $1.19. The decline also erased the gains Bitcoin had recorded following the election.
Equities Set the Tone for the Move
Stocks drove the crypto pullback, a session that showed digital assets trading in step with tech-heavy equity benchmarks. The Nasdaq Composite fell 5.52% on Thursday, wiping out as much as $2.5 trillion in market value, and Asian and European shares dropped on Friday as investors reassessed spending on AI infrastructure.
Crypto liquidations — which occur when exchanges forcibly close leveraged positions after losses exhaust a trader's margin — topped $1 billion earlier in the sell-off before easing to roughly $707 million over a 24-hour window. Leveraged long positions made up most of the early total. The Crypto Fear and Greed Index, a composite sentiment gauge scaled from 0 to 100, slipped to 31, a reading that sits within the fear range.
Jobs Data Shifts Rate Expectations
U.S. employers added 165,000 jobs in October, well above forecasts of 65,000, while the unemployment rate edged down to 4.1%. The unexpectedly strong labor figures raised bets that the Federal Reserve will lift interest rates again at its December meeting, with market expectations for another 25 basis point hike rising to a new high of 80% — a shift with broad relevance for risk assets, since rate expectations shape how investors price holdings valued for future growth.
BREAKING: Market expectations for another 25 basis point rate hike December rise to a new high of 80% after the October jobs report. The US economy added +100,000 more jobs than expected last month. pic.twitter.com/M0tWINRj1C
— The Kobeissi Letter (@KobeissiLetter) November 6, 2026
In the first reaction to the report, the 10-year Treasury yield rose 6.4 basis points to 4.894%. The next U.S. inflation report is due on November 10, and traders may use it to reassess those rate expectations.
Fund flows were also weak across crypto investment products, a channel often tracked as a gauge of demand through exchange-traded vehicles. Bitcoin ETFs posted $430.2 million in outflows, while Solana ETFs saw $800,000 leave.
SOL Tests Its 200-Day Average
SOL traded just above its 200-day simple moving average of $89.04 — a trend line built from roughly ten months of closing prices and one of the most widely watched long-term reference points in technical analysis. The nearest support sits at $88.30, and a break below it would put $87 in focus. A daily close under $85 could expose $80, where buyers may step in. If that level fails, the next downside target is $75.
Momentum indicators reflected the mounting selling pressure. The daily 14-period RSI read 32.4, just above the oversold threshold of 30, while the MACD line sat at −4.46, below the signal line at −3.81, with the histogram at −0.64, a measure of the gap between the two lines.
Analyst CryptoBullet pointed to the same setup on X, saying SOL had hit the 200-day moving average while its RSI entered oversold territory, and asked followers whether they were buying the dip.
$SOL hit the 200-Day MA ✅ RSI entered oversold territory Are you buying this dip? 😏 pic.twitter.com/zA0BDBPz0H
— CryptoBullet (@CryptoBullet1) November 6, 2026
For a rebound to build, SOL would first need to clear resistance at $95. A daily close above that level could bring $100 back into play, followed by $110.
A Record High and Remaining Challenges
Motley Fool writer Leo Sun noted that SOL reached an all-time high of $294.85 on January 18, 2025, and is now down nearly 70% from that peak. Its 52-week range runs from $60.40 to $171.62, and its market cap stands at $53.24 billion.
Sun wrote that Solana's Layer 1 network processes between 1,000 and 3,700 transactions per second, compared with 15 to 30 on Ethereum. He added that Circle, Visa, PayPal and Stripe use the network for stablecoin settlement and asset tokenization.
He also listed macro, competitive and regulatory challenges for the project, including the Democratic takeover of the House and Senate and the CLARITY Act, which failed in a Senate vote earlier this year. Sun said he would stay away from Solana for now.
As of 2:07 AM ET on November 7, SOL was up 0.84% at $90.08, with trading volume near $2 billion.

