Solana (SOL) Trades Near $89 as 2029 Price Targets Range From $262 to $1,200
Key Takeaways
- •Solana traded near $89 on November 8 after erasing most of its October rally toward $120, leaving the token far below its January 2025 peak near $295.
- •Weekly momentum signals point to fading buying strength, with the RSI at 44.99 below the neutral 50 level and a narrowing MACD gap that can precede a bearish crossover.
- •Key chart levels place immediate support at $85–$90 followed by $75–$80, while resistance lies near $100 and the $115–$125 band, above which a path toward $150 could open.
- •The Solana Foundation promoted the Alpenglow upgrade targeting roughly 150-millisecond transaction finality, alongside adoption developments involving J.P. Morgan Asset Management, Samsung Wallet, and Western Union.
- •US spot Solana ETFs logged approximately $25.07 million in net outflows on November 6, a move representing under two percent of the roughly $1.45 billion in cumulative fund inflows.
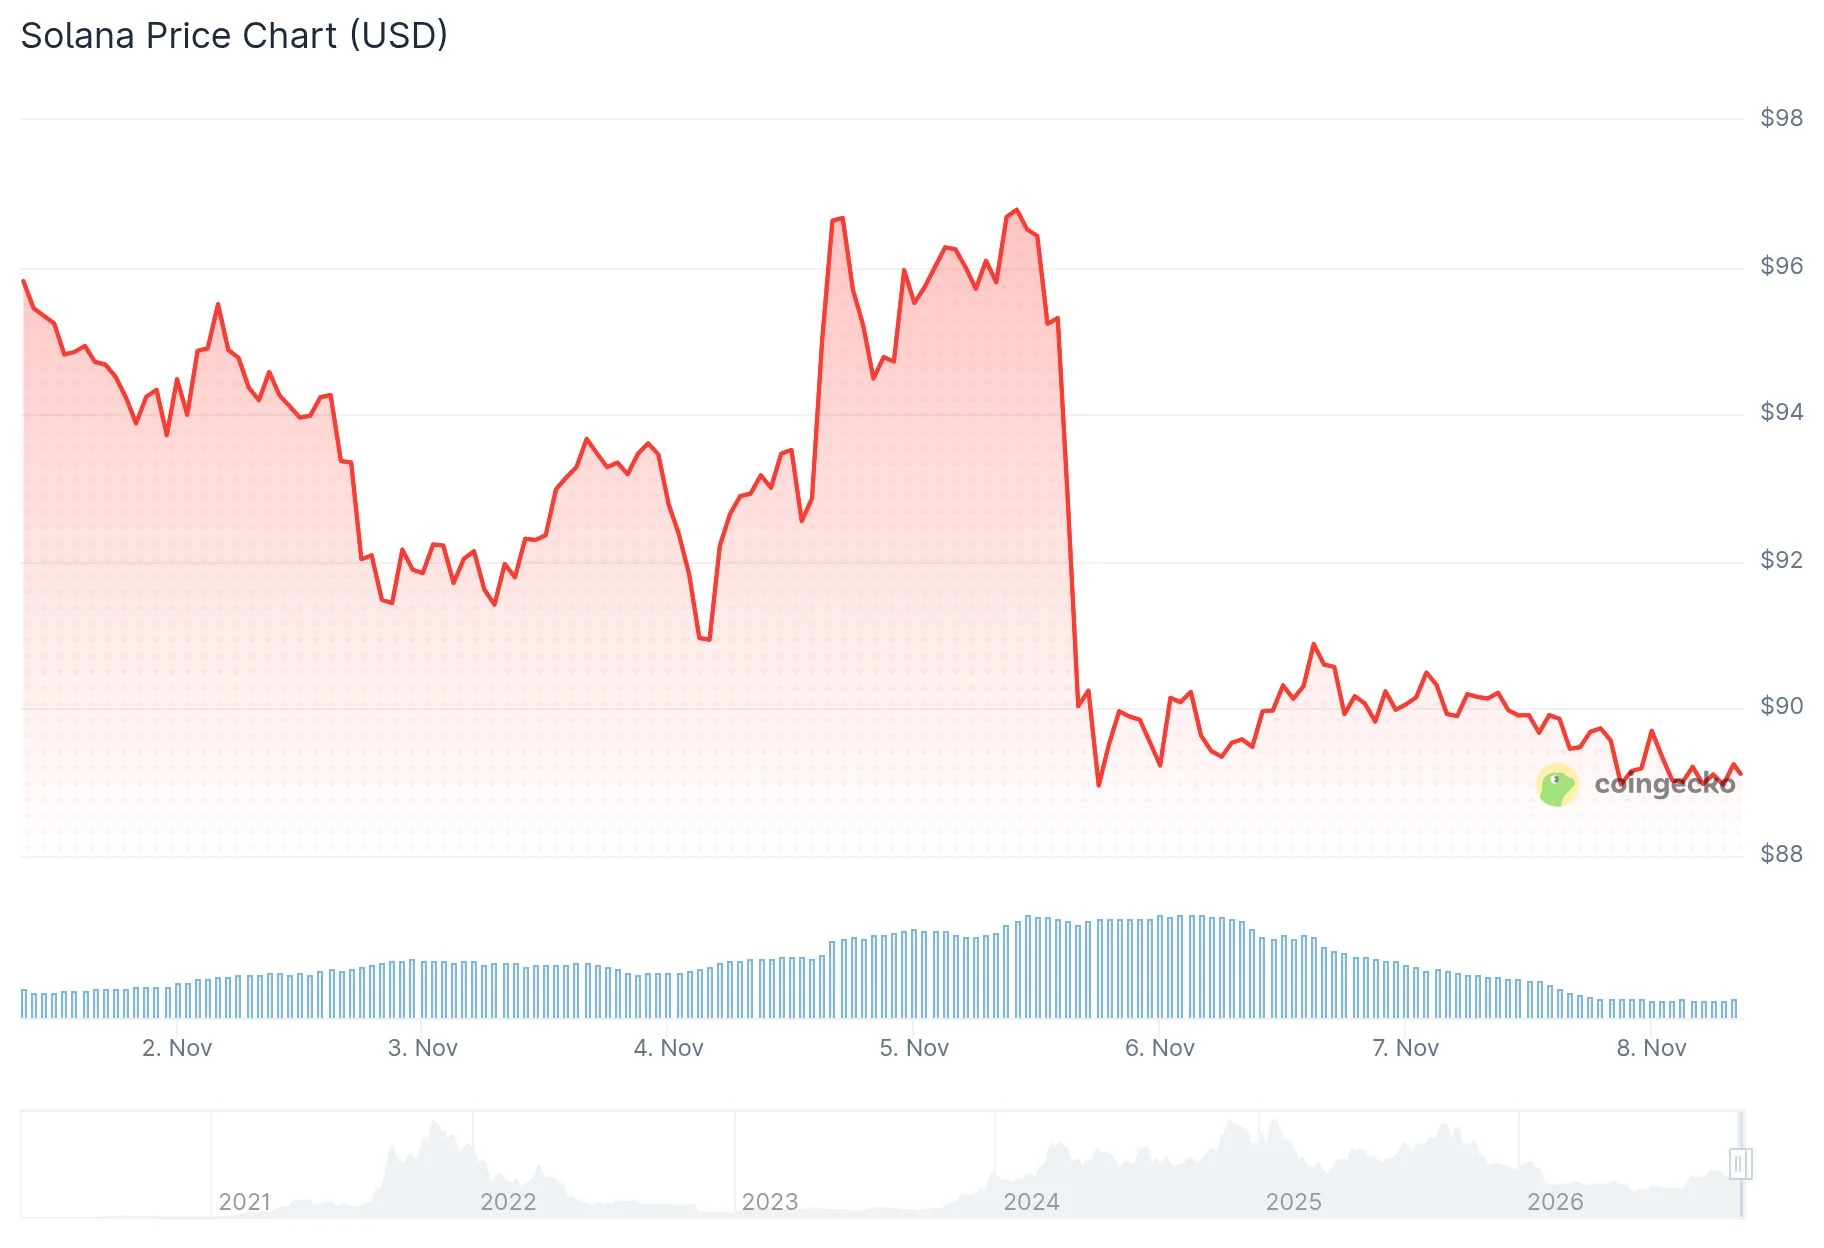
Solana (SOL) traded near $89 on November 8, according to CoinGecko price data, after giving back most of its October recovery, when the token climbed to around $120. Weekly chart data shows where buyers and sellers are now focused, and the market's ability to reclaim the widely watched $100 level has become a key reference point.
The asset rebounded from lows of roughly $60 to $65 during the summer, then rallied toward $120 in October before sellers pushed it back below $100, a round-number level tracked by many participants. The longer-term picture also remains well below earlier highs: SOL peaked near $295 in January 2025, and the weekly chart has yet to display a lasting recovery.
Weekly Momentum Signals
The weekly Relative Strength Index (RSI) reads 44.99, below the neutral 50 line, indicating weaker buying momentum than a month ago. Readings under 50 are often interpreted as a sign that sellers hold the upper hand.
The Moving Average Convergence Divergence (MACD) remains slightly positive, with the MACD line at 2.00 and the signal line at 1.50, although the gap between the two is narrowing. A shrinking gap can precede a bearish crossover.
Support and Resistance Levels on the Weekly Chart
Immediate support sits between $85 and $90, where the price is currently trading. The next zone below is the $75 to $80 consolidation area, and both zones are marked on the weekly chart. A sustained break beneath them could expose the summer lows near $60 to $65, which formed the base for the October rally and represent the next chart level below $75.
On the upside, the first resistance lies near $100, followed by the $115 to $125 band. A move above those levels would improve the chart structure and could open a path toward $150.
Analyst Jesse Olson offered a cautious short-term view on X on November 8. He said $SOL remains oversold on the daily chart, that price is drifting toward his fourth target, and that the token stays in a downtrend until proven otherwise. His post reads:
$SOL remains oversold on the daily chart. Price is drifting towards target four. Downtrend until proven otherwise. pic.twitter.com/S7983eoLI8 — Jesse Olson (@JesseOlson), November 8, 2026
Network Upgrades and Adoption Data
The Solana Foundation highlighted two October network upgrades on November 6. One was Alpenglow, which targets transaction finality of about 150 milliseconds — finality being the point at which a transaction is considered settled. That property matters most for payment use cases, where a transfer is not treated as sent until it is final. The Foundation also reported developments involving J.P. Morgan Asset Management, Samsung Wallet and Western Union, pointing to growing interest in payments and tokenisation infrastructure built on the network.
DefiLlama data shows roughly $5.2 billion in decentralised finance total value locked on Solana. Stablecoin supply on the network stands at $14.6 billion, and weekly decentralised exchange volume totals $10.7 billion. These figures measure network activity rather than the SOL price.
2029 Price Forecasts
Standard Chartered analyst Geoffrey Kendrick forecast $1,200 for SOL by 2029 in research published in February 2026. The bank subsequently lowered its 2026 target from $250 to $135. PrimeXBT projects a more conservative 2029 range of $262 to $411, with an average near $339. The top of the Standard Chartered projection sits nearly three times as high as the top of the PrimeXBT range — a measure of how widely professional long-horizon forecasts for the same asset can diverge. Reaching $500 from $89.10 would represent a gain of about 461%.
The next Bitcoin halving is expected in 2028, and both sets of forecasts target the year following that event.
Spot ETF Flows
US spot Solana ETFs recorded approximately $25.07 million in net outflows on November 6, according to SolanaFloor. Bitwise's BSOL accounted for $14.44 million of that total. Daily flow tallies cover the listed funds themselves rather than SOL traded on exchanges or transacted on-chain, and they are updated each trading day. Cumulative inflows into the funds remain around $1.45 billion. Measured against that cumulative total, the November 6 outflow amounts to a shift of under two percent.
Source: CoinCentral

