Solana (SOL) Holds Near $121 as Traders Watch Key Resistance Zone
Key Takeaways
- •Solana traded at $121.44 on October 5 with a 0.28% daily gain, holding within a 24-hour range of $120.00 to $122.29.
- •Every major moving average, including the 200-day at $86.16 roughly 41% below spot, sits under the price and is rising, a configuration classical technical analysis associates with an established uptrend.
- •SOL faces a resistance zone between $122.49 and $123.53 after recent rejections, with a MACD histogram at zero and an RSI of 65.58 indicating the rally has slowed.
- •On Binance Futures, top traders are 64.3% long and the funding rate is neutral at 0.0100%, but open interest fell 7.29% in 24 hours to about $984 million, suggesting traders are closing existing positions rather than opening new ones.
- •Analyst Rebeca Moen gives the bullish case a 55% probability, targeting $128 to $130 if SOL clears $122.49 on volume, versus a 45% bearish case toward $116.31 or $113 to $114 if support at $120.20 fails.
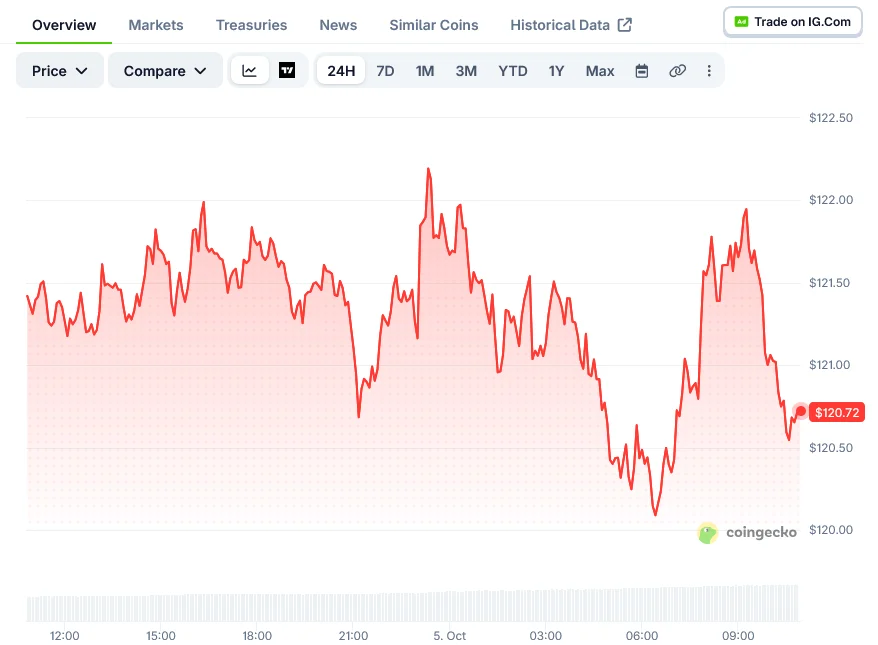
Solana (SOL) traded at $121.44 on October 5, gaining 0.28% over the day while holding within a narrow 24-hour range of $120.00 to $122.29, according to Blockonomi.
All Major Moving Averages Below Spot Price
Every major moving average for SOL currently sits below the market price. The 7-day average is at $119.57, the 20-day at $116.31, the 50-day at $105.66, and the 200-day at $86.16. All of these averages are pointing upward, and the 200-day sits roughly 41% below the current price. In classical technical analysis, a spot price trading above rising moving averages is the structure associated with an established uptrend, which is why this configuration is one of the most closely watched signals on SOL's daily chart.
Resistance Zone Between $122.49 and $123.53
Traders are watching a resistance zone between $122.49 and $123.53. SOL has faced rejections near the lower end of that range during recent sessions.
Momentum indicators show the recent rally has slowed. The MACD histogram reads zero — the midpoint between bullish and bearish momentum on that measure — while the Relative Strength Index (RSI) stands at 65.58, just below the 70 threshold conventionally labeled overbought. The Stochastic %K is at 71.68, crossing above %D at 57.35, which points to a modest short-term rise in momentum.
On the Bollinger Bands, SOL holds a %B reading of 0.70 — a scale that runs from 0 at the lower band to 1 at the upper — placing the price in the upper portion of its recent range, with the upper band sitting at $128.90. The daily pivot is at $121.24, just below the current price. Immediate support is at $120.20, with the next level at $118.95.
Derivatives Data Shows Mixed Signals
On Binance Futures, top traders are 64.3% long and 35.7% short, producing a long/short ratio of 1.80. Retail traders are also mostly long, at 62.1%.
Open interest fell 7.29% in 24 hours to about $984 million. A drop in open interest alongside a flat price usually indicates traders are closing existing positions rather than opening new ones.
The funding rate stands at 0.0100%, a neutral level. Funding rates are periodic payments exchanged between perpetual futures traders, and readings near zero are generally interpreted as balanced positioning between longs and shorts. The taker buy/sell ratio is 1.0999 — a figure above 1.0 means aggressive market buys outpaced market sells over the period — with approximately $350,000 in aggressive buys against $318,000 in aggressive sells.
Analyst Outlines Two Scenarios for the Next 14 Days
Blockchain.news analyst Rebeca Moen laid out two possible paths for SOL over the next 14 days, assigning a 55% probability to the bullish case and 45% to the bearish case.
In the bullish scenario, SOL clears $122. on strong volume and holds above $123.53, which could send the price toward $128 to $130. A failure to reclaim $122.49 within five sessions would cancel this view.
In the bearish scenario, SOL loses support at $120.20 and drops toward the 20-day average at $116.31. A deeper move could reach $113 to $114, where the 26-day EMA sits, with a daily close below $118.95 confirming this path.
The analysis also noted that Bitcoin's price movement over the next two weeks may determine SOL's direction, as layer-1 tokens like Solana tend to follow broader crypto sentiment.
At 10:54 UTC, live data from CoinGecko showed SOL at $120.69, down 0.02% on the minute chart.
This article originally appeared on Blockonomi.

