Solana Loses Its Summer Floor as the June Low Near $60 Comes Back Into View
Key Takeaways
- •Solana lost the 0.786 Fibonacci retracement near $74, the final labeled support above $60, and traded near $69 on Friday, down 6.14%, after touching an intraday low around $68.
- •Measured from the June low near $60 to the late-September peak at $125, Solana has surrendered roughly 87% of its rally and sits 45% below the high.
- •The November 17 close above $75 reversed within a day, and under standard charting convention the broken support now serves as resistance, with the 0.618 retracement near $85 and the 200-day moving average at $89 forming the next band above.
- •Momentum indicators are stretched, with the 14-day RSI at 23.5 sitting below its own average near 24.1, while the 50-day moving average has slipped beneath the 100-day without yet forming a 50/200 death cross.
- •US spot Solana ETFs took in $271.6 million in September but recorded $143.7 million in net outflows in October, and Roundhill asked the SEC to withdraw its proposed Solana covered-call ETF on November 18.
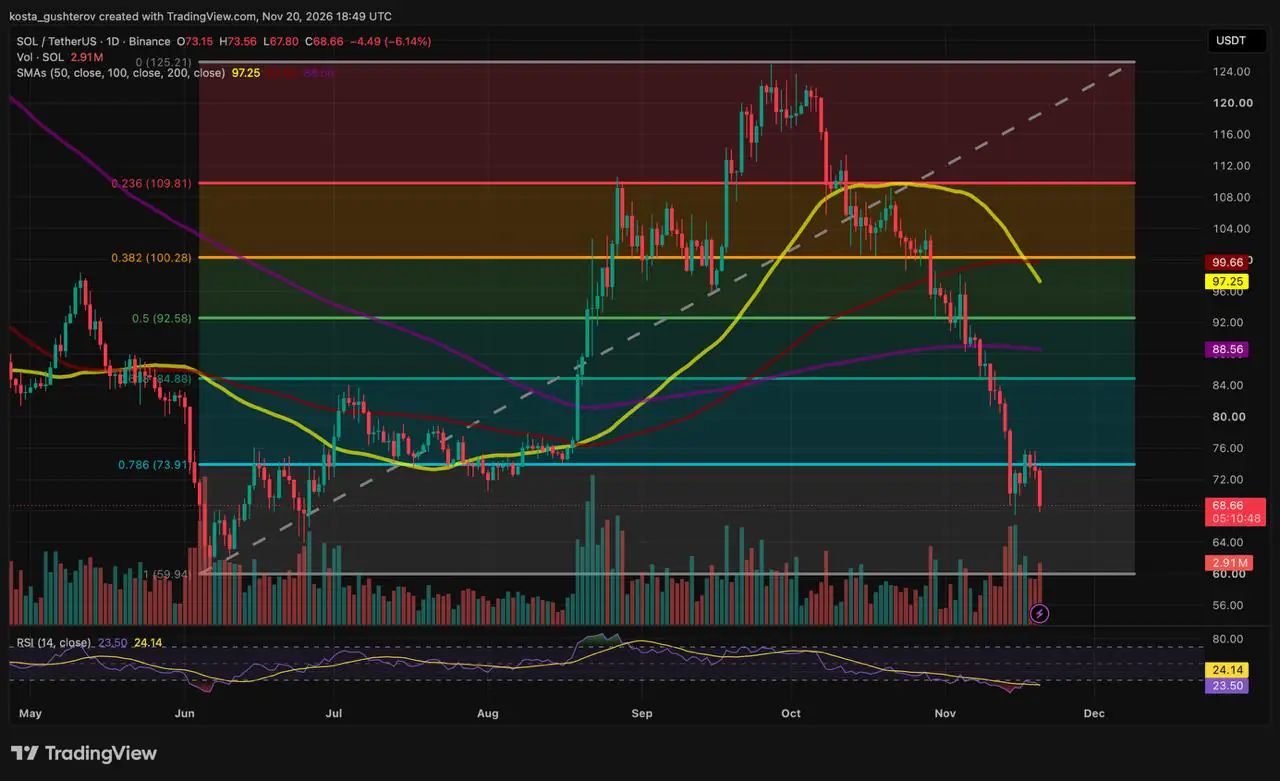
Solana has lost the last technical floor standing between it and its June lows. After trading near $79 a week ago, SOL gave way within days at the 0.786 Fibonacci retracement near $74 — the level Coindoo's November 13 analysis identified as the final labeled support above $60 — and sellers have kept the upper hand ever since.
The Level SOL Couldn't Hold
Fibonacci retracements are ratios projected from a completed price swing — here, the June-to-September advance — that traders use to frame where a pullback may lose steam; the 0.786 ratio is among the deepest of them before a move gives back its entire swing.
This week's trading has revolved around that line. SOL broke below it within days, then managed a single close back above it on November 17, near $75. It slipped under the level again over the following two sessions, and Friday's candle opened just beneath it, near $73. The session high fell roughly 35 cents short of the level before sellers drove the price to an intraday low near $68. As of 18:49 UTC, with about five hours left in the session, SOL traded near $69, down 6.14%.
The failed November 17 close also raises the bar for any recovery. A close above $75 has already occurred and reversed within a day, so a reclaim that matters would need to hold for more than one session.
From Floor to Ceiling
The same level played the opposite role a few months ago: during the summer advance it acted as resistance, and the rally through it is what turned it into the support that just broke. Under standard charting convention, a support that fails is often treated as resistance on the way back up, so the line that failed now doubles as the ceiling any recovery would have to clear.
87% of the Summer Rally Erased
Measured from the June low near $60 to the late-September peak at $125, SOL has surrendered roughly 87% of its rally and now sits 45% below the high. Overhead, the 0.618 retracement near $85 — the most closely watched of the Fibonacci ratios — and the 200-day moving average at $89 sit close together, forming the next resistance band above the broken 0.786 level, a zone chartists tend to flag because two widely followed references overlap there. Below the price, the full retracement near $60 is the only labeled level remaining; it marks the June low from which the entire Fibonacci grid is drawn.
What June Actually Looked Like
The territory between Friday's price and the June low has trading history behind it. After the early-June plunge to near $60, SOL spent weeks oscillating between that low and the level it now tests from below, printing long wicks in both directions and staging a late-June pullback into the lower part of the range. None of that range carries a labeled level on this chart, but buyers and sellers have traded there before. Friday's low near $68 is the first line to watch; beneath it, the June range serves as the reference all the way down to the full retracement near $60.
Averages Above, Momentum Stretched
All three daily moving averages — smoothed closing prices over their respective windows and among the most widely followed trend gauges in chart analysis — sit above the price: the 100-day at $100, the 50-day at $97 and the 200-day at $89. The 50-day has just slipped beneath the 100-day as it turns sharply lower. It remains above the 200-day, so the chart has not printed the 50/200 "death cross" — the widely tracked pattern that forms when the 50-day average crosses below the 200-day and that many chartists read as a sign of a deteriorating long-term trend — but SOL trades about 22% below even the lowest of the three.
Momentum tells a different story. The 14-day Relative Strength Index — a 0-to-100 momentum gauge on which readings below 30 are conventionally labeled oversold — reads 23.5, well inside oversold territory, and it is still below its own average near 24.1, meaning it has not turned upward. The only comparable reading on this chart came in early June, at the low from which the Fibonacci grid originates. Oversold readings this low can persist through a strong selloff, yet they can also produce sudden short-covering spikes, so the signal cuts both ways.
Volume leans toward the sellers, with a caveat. It spiked during the mid-November breakdown, faded during the bounce and picked up again on Friday: 2.91 million SOL traded with hours still remaining in the session, already above the bounce days. The candle is unfinished, however, and volume remains lighter than on the breakdown days.
Outside the Chart
SOL's slide unfolded during a busy stretch for the network. Solana completed its move to 200-millisecond slots — the intervals in which the blockchain produces blocks — on October 9, halving its original 400-millisecond target, according to the Solana Foundation's upgrade page. SOL traded above $100 at the time. Last weekend, the network dropped its "mainnet beta" label and adopted Solana 1.0 as a shared version number — a change CoinDesk noted does not make transactions faster or affect holders. The label had been carried since the network's launch more than six years ago. The Solana Foundation's annual Breakpoint conference ran in London from November 15 to 17. None of it slowed the decline, and neither did long-range valuation work such as Bitwise's $1,100 scenario, whose assumptions run out to 2031.
Fund flows align more closely with the chart. US spot Solana ETFs — funds that hold the token directly, with daily creations and redemptions publicly reported — took in $271.6 million in September as SOL rallied to its high, then recorded $143.7 million in net outflows in October as the breakdown began, according to CoinDesk. On November 18, Roundhill asked the SEC to withdraw its proposed Solana covered-call ETF — a structure that sells call options against its holdings to generate income — which had never sold a share. Friday's drop also came alongside the broader market, as Bitcoin briefly fell to around $59,000. Bitcoin is the largest cryptocurrency by market capitalization, and its moves are commonly read as a gauge for the wider crypto market.
Three Ways Out
The chart's own reference points sketch the exits. To the upside, a close back above the broken 0.786 level — the reclaim that briefly succeeded on November 17 — would need to hold for more than a single session. In momentum terms, the RSI at 23.5 turning back above its own average near 24.1 would be the first sign the indicator has turned upward. To the downside, Friday's low near $68 is the first line to watch, with the June range stretching below it to the full retracement near $60, the last labeled level on the grid.
These are conditions, not a forecast. Until one of them triggers, SOL sits between a level it has failed to hold twice in a week and a low it has not tested since June.

