Solana Holds Near $76 as ARK Invest Adds 3iQ Solana Staking ETF Exposure
Key Takeaways
- •ARK Invest purchased 7,115 shares of the 3iQ Solana Staking ETF on August 17, distributing the position across its Next Generation Internet and Blockchain & Fintech Innovation funds.
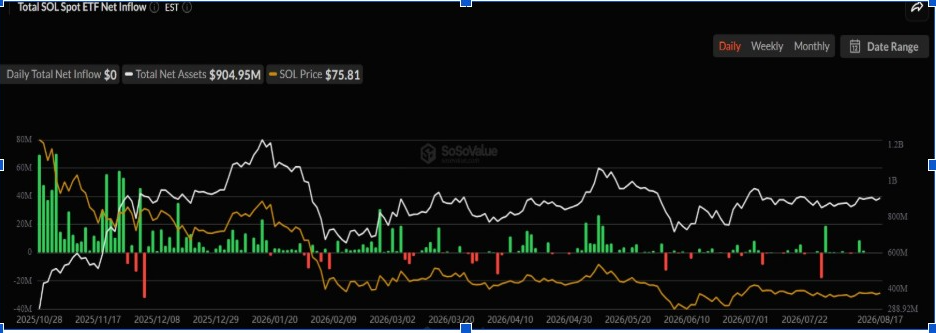
- •Solana-focused ETFs have recorded no new inflows since August 12, following $10.26 million in inflows between August 10 and 14 that marked their strongest weekly total in three months.
- •Solana's DeFi total value locked has fallen from $8.19 billion to roughly $4.85 billion, while SOL-denominated deposits declined from about 75 million on June 7 to 63.84 million.
- •Analyst CryptoPatel identified a long-term accumulation zone between roughly $45.24 and $66.25, with SOL currently trading only modestly above its upper boundary.
- •A two-week chart places the first significant support near $66.25 and major resistance around $125.55, with speculative long-term targets at $300, $500 and $1,000.
Solana (SOL) held near $74 as Cathie Wood's ARK Invest reportedly increased its exposure to the 3iQ Solana Staking ETF. According to a post by ARK Daily, purchases totaled 7,115 SOLQ shares on August 17. The buying came against a weaker network backdrop: Solana trades near $76, DeFiLlama places the network's decentralized finance total value locked near $4.85 billion as SOL-denominated deposits fall to 63.84 million, and the long-term price chart keeps the $66 region in focus.
ARK Invest Adds More Solana Exposure
ARK Invest purchased 7,115 shares of the 3iQ Solana Staking ETF on August 17, spreading the exposure across two of Cathie Wood's actively managed funds. The ARK Next Generation Internet ETF acquired 3,830 shares, while ARK's Blockchain & Fintech Innovation ETF added another 3,285 shares.
The purchases give ARK additional Solana exposure through a regulated investment product rather than direct token ownership. The staking structure also links the investment to rewards generated through Solana's proof-of-stake network.
ARK's move comes while broader demand for Solana ETFs has recently weakened. SOL-focused ETFs have recorded no new inflows since August 12. Still, the preceding week produced stronger demand: Solana ETFs attracted $10.26 million between August 10 and August 14, marking their strongest weekly inflow in three months.
ETF Demand Meets a Softer Network Picture
However, Solana's network data presents another source of caution. Total value locked across its decentralized finance ecosystem has fallen from $8.19 billion to approximately $4.85 billion. The decline also appears when TVL is measured directly in SOL. DeFi protocols held around 75 million SOL on June 7; that figure has since fallen to 63.84 million SOL, a gap equal to roughly 11.16 million SOL that have exited DeFi apps over the specified timeframe.
One possible reason for a dollar-denominated TVL decline is the drop in token prices. However, SOL terms have been falling as well, indicating real drops in deposits. That matters when assessing the strength behind SOL's current recovery: despite the market's renewed interest in price and volume, the DeFi balance shows a downward trend, indicating that network capital has not increased at the same rate.
SOL Long-Term Setup Returns to Accumulation
Meanwhile, a two-week Coinbase chart shared by CryptoPatel places SOL price close to a broad long-term accumulation region. The analyst identified roughly $40 to $60 as the preferred accumulation range. The chart itself marks a wider technical zone between approximately $45.24 and $66.25, and SOL currently trades only modestly above its upper boundary.
This area resembles the accumulation structure formed during the 2022 and 2023 market bottom. SOL later rallied sharply from that base and reached the $250 region. The current cycle has since produced another major correction, with price dropping below the $125.55 horizontal level after failing to sustain momentum around its previous highs.
CryptoPatel maps longer-term targets at $300, $500 and $1,000, and the chart also marks $700 before the highest projection. These levels represent speculative long-term targets rather than confirmed destinations. SOL must first establish a durable bottom and recover major resistance levels.
$66 Support in Focus
Notably, the two-week chart records a recent close near $75.43 after reaching $76.23. The first meaningful downside level sits around $66.25, the price that marks the upper boundary of the highlighted long-term accumulation zone. A break below $66 could expose the $60 region cited by CryptoPatel, while deeper weakness would shift attention toward $45.24 and the broader $40 area.
On the upside, SOL faces a much larger hurdle near $125.55. That level previously acted as an important structural boundary during the current market cycle. Beyond $125, the $250 region becomes another major barrier.
Source: The Market Periodical

