Solana Tests Key Support Near $70 as Bears Eye Drop Toward $65
Key Takeaways
- •Solana traded near $73.50 in early August while remaining below a descending resistance line that has produced lower highs since the token peaked above $83 in early July.
- •Multiple analysts identified $70 as critical support and $73.76 as the immediate resistance level that will determine SOL's next directional move.
- •A confirmed breakout above resistance could target the $78 level, while a breakdown below $70 may expose a demand zone near $65.
- •Analyst Fella noted that SOL trades approximately 75% below its all-time high near $260 reached in November 2021, with the token currently sitting in a broad weekly demand zone between $70 and $84.
- •Broader cryptocurrency market deterioration throughout late July and into August has added pressure on SOL and other major Layer 1 tokens, making wider sentiment a key factor in whether support levels hold.
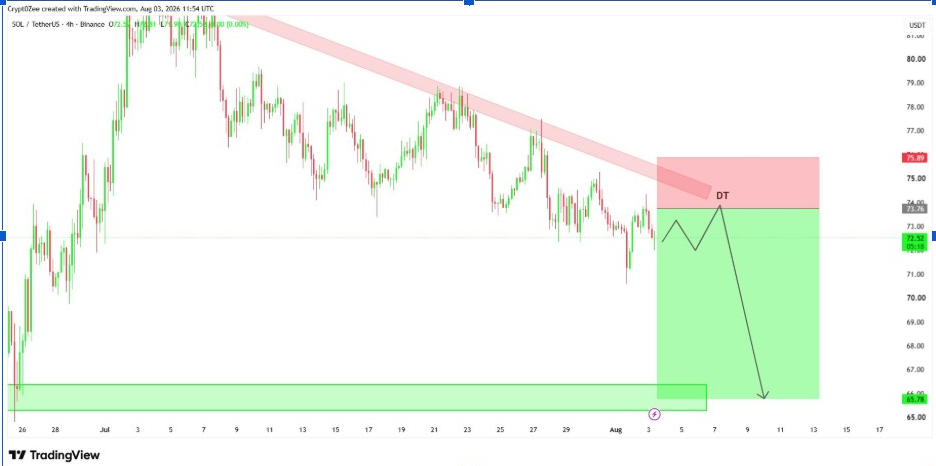
Solana (SOL) traded near $73.50 in early August after buyers defended a sharp decline, but the broader market structure continued to favor sellers as the token posted lower highs across multiple time frames. The pullback came amid a wider crypto market downturn that pressured major assets throughout late July and into August. The next directional move hinges on a narrow range between $70 support and $73.76 resistance, with a confirmed breakout opening the path toward $78 and a breakdown potentially exposing the $65 region.
Solana Tests a Critical Range
SOL recovered from a brief dip below $71 to trade near $73.50, though the four-hour chart kept the token beneath a descending resistance line. Analyst CryptoOzee identified $73.76 as the first trendline test and a possible rejection area, projecting a short-term recovery into that resistance before another potential decline.
Under that bearish scenario, sellers could push SOL toward a demand zone near $65.70. However, the setup would weaken above $75.89 — a sustained move beyond that level would clear immediate resistance and improve the short-term structure.
SOL has formed lower highs since trading above $83 in early July, with each recovery stalling below the previous swing high. The $73.76 level thus represents the first major test before resistance between $75 and $76. Historical data showed SOL trading above $82 in early July before falling below $74 later in the month. Failure to reclaim the trendline would keep sellers in control and leave $70 as the final nearby support before a deeper decline.
Weekly Structure Highlights Lower Demand Zones
The weekly chart places SOL inside a broad historical demand area. Analyst Fella identified the current zone between roughly $70 and $84, noting that this band has slowed the decline even though buyers have not produced a decisive reversal. Fella also observed that SOL trades approximately 75% below its all-time high near $260, reached during the November 2021 bull market peak — a drawdown that mirrors broader losses across major Layer 1 tokens since the 2021 cycle highs.
SOL now sits near the lower portion of that range. An additional demand zone appears between $58 and $65, closely matching the shorter-term target around $65.70. A deeper weekly support area sits near $40 to $50, where SOL recorded strong reactions during earlier market cycles.
On the upside, major weekly supply begins near $120, with a second resistance band around $138 to $145. Those levels remain distant while SOL trades below $80, making $70 the more immediate market threshold. Solana's position as one of the largest smart contract platforms by market capitalization means that its price action at these levels is closely watched by traders tracking relative strength across the Layer 1 sector.
Short-Term Reversal Requires Confirmation
Analyst Crypto Tony indicated he is waiting for another test of $70 before considering an entry. His one-hour chart keeps SOL beneath a falling trendline connecting several lower highs — a line that now approaches the $75 area after starting near the early July peak around $84.
The preferred scenario envisions SOL dipping toward support between $69 and $70, then rebounding toward $77 or $78 once buyers step in. This setup requires a strong reaction near support and a confirmed break above the descending trendline. A clean move below $69 would weaken the rebound case, potentially allowing sellers to push prices toward the next demand area near $65. The candle structure around $70 may provide the clearest signal, particularly if trading volume rises during the test.
Breakout Path Could Target $78
Analyst BitGuru also identified the area around $70 as a possible reversal zone, marking key support near $70.08 on the four-hour chart. The projected path shows SOL stabilizing between $70 and $73 before turning higher, with the first obstacle near $75 where the falling trendline may attract fresh selling.
A break above that level would place $78 resistance in focus. BitGuru marked the wider horizontal barrier around $78.50.
SOL followed a clear pattern of lower highs and lower lows throughout July, with several brief rebounds failing beneath nearby resistance. That structure would only improve once buyers reclaim a previous swing high and hold it during a retest. A move through $78 would offer the first stronger reversal signal, and clearing that barrier could expose the larger resistance zone near $83 — a level that capped price before the latest selloff and may attract profit-taking during any recovery. Whether broader market sentiment stabilizes or deteriorates further will likely influence whether SOL's technical support levels hold under continued selling pressure.

