Solana Price Analysis for September: A Death Cross Looms as SOL Tests $105
Key Takeaways
- •The $105 zone combines the 23.6% Fibonacci retracement, a descending trendline, and the 50-week moving average, and SOL must close above it and hold through a retest before it becomes support.
- •A weekly death cross has formed as the 50-week moving average fell below the 200-week average, a lagging signal that typically appears only after an extended downtrend.
- •Solana's stablecoin market cap rose 5.05% in seven days to roughly $16.42 billion, while seven-day DEX volume fell 11.02% and perpetual-futures volume declined 5.78%.
- •On September 3 the Solana Foundation introduced Payment Channels, which settle only final balances onchain after offchain signed payment updates, and a proxy test with 100,000 wallets processed more than one million payment updates per second.
- •Sustained Payment Channels usage could raise SOL fee demand and reduce supply through the burn mechanism, but a weekly close above $105 and then a move through $134 are needed to give the recovery technical credibility.
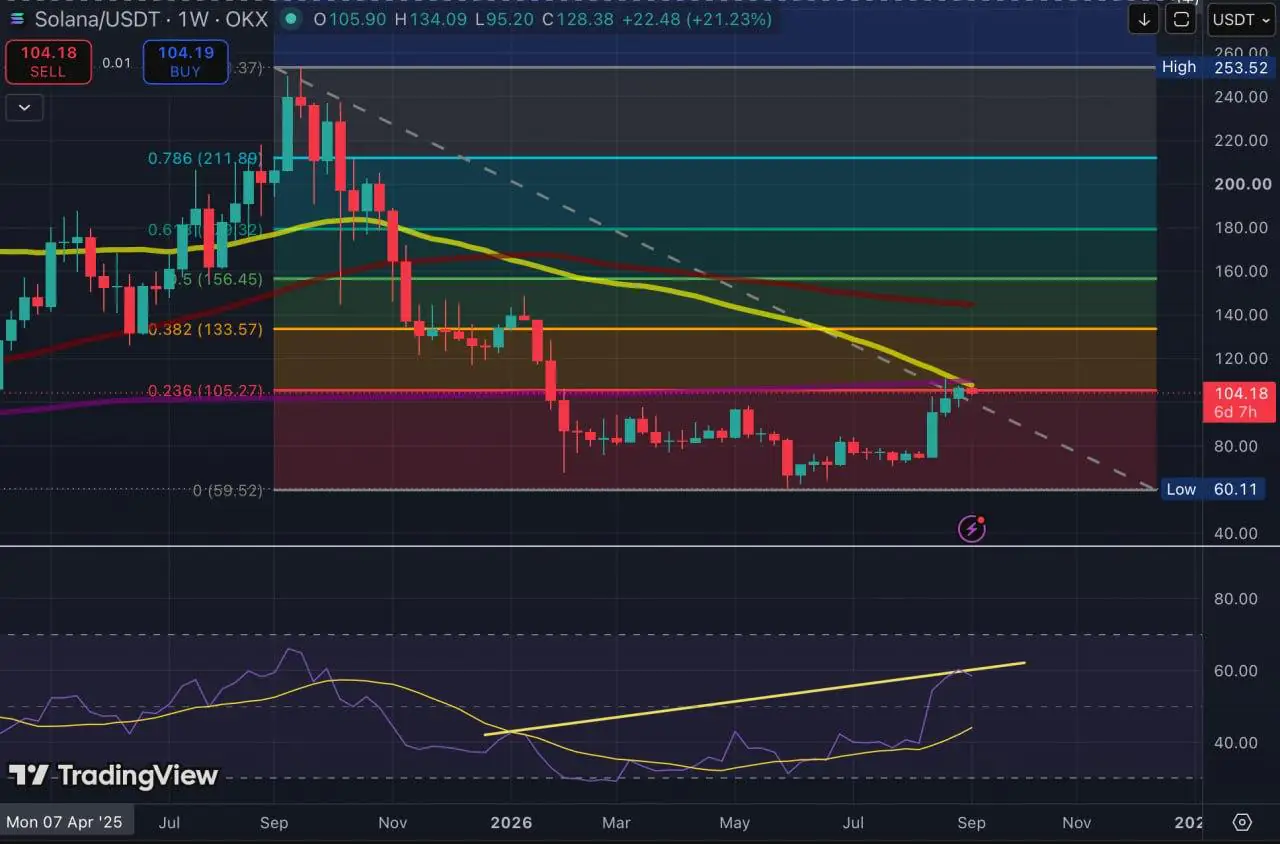
Solana (SOL) is trading higher after its August rally, during which the token briefly touched $110, its monthly high. Attention on the weekly chart has now shifted to $105, the first resistance zone the recovery needs to clear.
$105 is a resistance cluster, not a single price
The 23.6% Fibonacci retracement sits at $105, near the descending trendline and the 50-week simple moving average. Together, these levels form the first major resistance zone for SOL's recovery.
A single daily close above that area would not change the weekly structure. SOL must close above $105 and hold the level through a retest before the market can treat it as support. Until that happens, the rebound remains a challenge to the prevailing downtrend rather than a reversal of it.
RSI shows selling pressure weakened
During the decline into June, SOL printed a lower price low while its weekly RSI formed a higher low. This mismatch is known as a bullish divergence: price kept falling, but the momentum behind the sell-off was fading. It suggests sellers were losing control heading into the June bottom.
The signal only becomes meaningful if price follows through. A sustained weekly move above $105 would show buyers responding to the improvement in momentum; another rejection there would leave the divergence intact without confirming a trend change.
The death cross is already in place
The 50-week moving average has dropped below the 200-week average, creating the death-cross condition. Traders monitor this crossover because it signals that the shorter-term trend has weakened relative to the longer-term trend, although the crossover itself is a lagging indicator rather than a forecast for the next weekly candle. Weekly-timeframe death crosses are relatively rare for large-cap crypto assets and typically form only after an extended downtrend has already been underway, which is consistent with SOL's slide from higher levels earlier in the year.
The 50-week and 200-week averages are converging around $105, which adds to the significance of that zone. The 100-week average sits in the mid-$140s, presenting a further barrier if SOL pushes beyond the first retracement level.
Stablecoin supply rose, but trading volume fell
According to DeFiLlama, Solana's stablecoin market cap stood at roughly $16.42 billion at the time of writing, up 5.05% over seven days. The figure covers stablecoins circulating across the network, including balances held in wallets and DeFi applications. That places Solana among the largest stablecoin venues outside Ethereum, where the bulk of dollar-pegged token supply circulates.
This matters because those stablecoins can be used to buy SOL on Solana-based exchanges or posted as collateral on onchain perpetual platforms. A larger stablecoin balance expands the pool of dollar-denominated capital available on the network, but it does not reveal how much is actively deployed in SOL trading pools, order books, or derivatives margin.
So far, trading activity has not confirmed a broad expansion in demand. Solana's seven-day DEX volume fell 11.02%, while perpetual-futures volume declined 5.78%. A recovery above $105 would carry more weight if turnover began rising alongside the stablecoin balance, indicating that more of that capital is flowing into SOL markets instead of sitting in wallets, lending protocols, or payment balances.
Recent network usage also remains relevant — Solana fees reached record levels earlier this month — but fee growth alone does not determine the weekly chart trend.
Payment Channels show where that liquidity could be used
Growing stablecoin liquidity becomes more consequential when applications give users a reason to move it. On September 3, the Solana Foundation introduced Payment Channels, which let users or software agents authorize a spending limit once, exchange signed payment updates offchain, and settle the final balance onchain.
The Foundation said a proxy test involving 100,000 wallets issued more than one million payment updates per second. That figure does not describe Solana's base-layer throughput: the payment updates are aggregated, and only final settlements reach the chain. The design resembles payment-channel constructions used elsewhere in the industry, where offchain message-passing reduces onchain load and only net results are settled.
The price connection is indirect, but sustained adoption could matter for SOL's economics. Every final settlement on Solana requires transaction fees paid in SOL, and half of each base fee is burned. If Payment Channels drive more channel openings, settlements, and other onchain activity, they could increase SOL-denominated fee demand while reducing circulating supply through the burn mechanism. That could potentially support the token only if usage becomes large and persistent; the test itself is not evidence of new SOL buying.
SOL now needs to turn $105 into support
For the recovery to gain technical credibility, SOL needs a weekly close above $105, followed by a move through $134. That would demonstrate that buyers have cleared the first Fibonacci barrier and begun repairing the damaged moving-average structure.
A rejection below $105 would keep SOL beneath the falling trendline and preserve the broader weekly downtrend. The RSI divergence would still show that sellers lost momentum into June, but buyers would need further evidence before the move could be called a durable reversal.
This article is for informational purposes only and does not constitute financial advice.
