Solana Tests Key $78 Resistance as Technical Setup and Flat ETF Flows Frame Outlook
Key Takeaways
- •Solana is encountering crucial resistance between $78 and $78.70, where a successful breakout may pave the way toward $80.
- •Analyst Ali Charts suggests that breaching this mid-range barrier could initiate a larger upward movement toward $100.
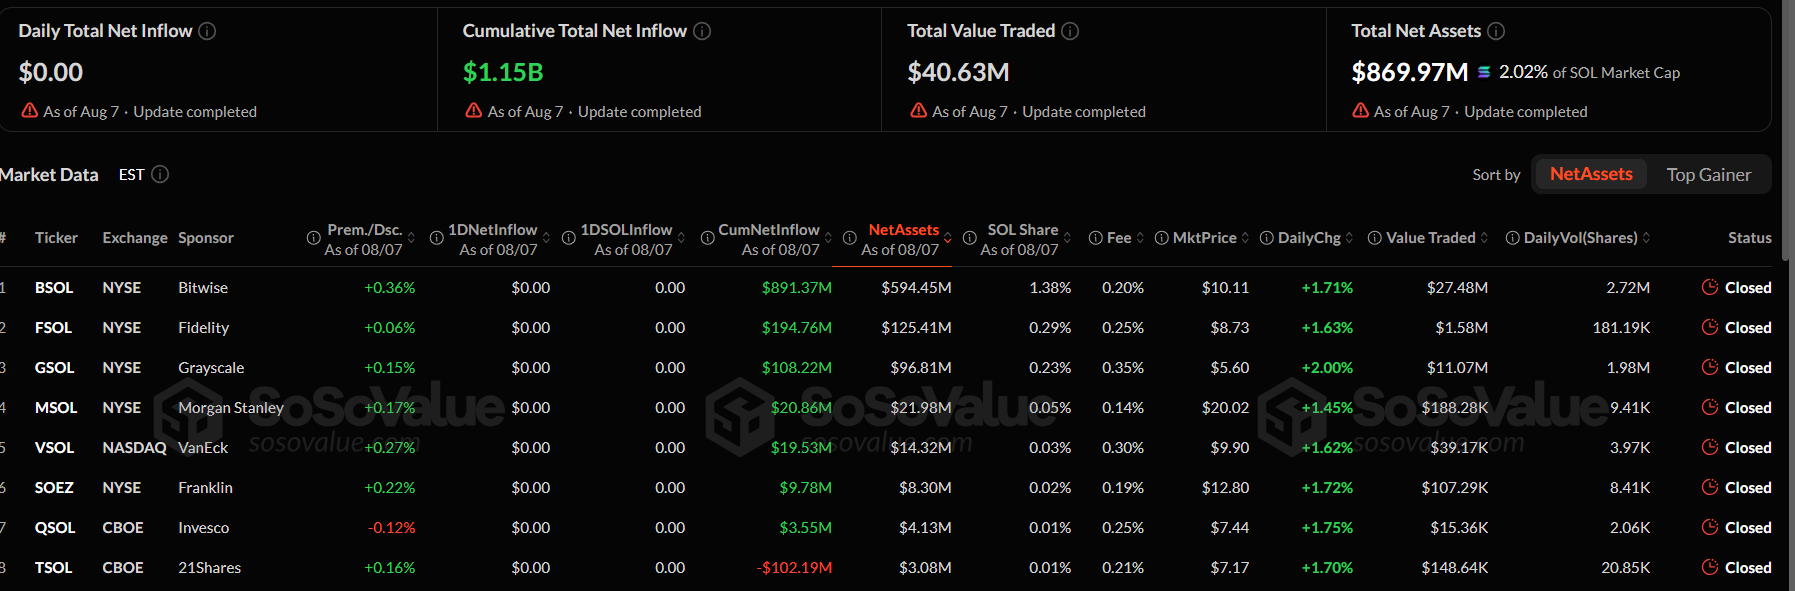
- •United States spot Solana ETFs recorded no new inflows on August 7, despite maintaining total net assets of approximately $870 million.
- •The Senate has postponed further review of the CLARITY Act, which seeks to clarify regulatory jurisdiction over digital assets, until after the August recess.
- •Technical momentum indicators show mixed signals, featuring a recent MACD golden cross alongside an overbought Relative Strength Index.
Solana is testing a key technical area near $78 after extending a higher-low structure from the $72 support zone. SOL traded near $76.47 as the move keeps market attention on resistance between $78 and $78.70, where a confirmed breakout could strengthen the case for a push toward $80.
Market analyst Ali Charts identified a broader parallel channel pointing toward $100 if buyers clear the mid-range. Traders are balancing that setup against flat Solana ETF flows and renewed policy uncertainty surrounding the CLARITY Act, leaving price action dependent on technical confirmation rather than any single ETF session or policy headline.
2/5 Solana appears to be trading within a parallel channel.
A break above the mid-range near $78 could trigger a move toward the channel's upper boundary around $100 for $SOL. pic.twitter.com/c0fU5BTmgp
— Ali Charts (@alicharts) August 9, 2026
Breakout Faces a Critical Test Near $78
SOL has recovered since defending support at $72 and reclaiming $75. The four-hour structure shows a rising channel, while higher lows keep the trend constructive. The $78 area remains the primary barrier — a decisive break could open the way toward $80 before traders assess the next resistance near $82.
Ali Charts views the same region as the key trigger for a broader move. His chart places Solana inside a parallel channel with its midpoint near $78, and he identified setup resistance around $78.70. Clearing that zone could shift attention toward the channel's upper boundary near $100. The analyst also highlighted a daily TD Sequential buy signal and a MACD golden cross — two momentum indicators that traders commonly watch for early signs of trend continuation, though neither guarantees follow-through.
Momentum readings still require caution. The Relative Strength Index sits near 71.14, placing SOL slightly inside overbought territory. The MACD line remains above its signal line, while the positive histogram supports current upside momentum. However, the histogram appears to be flattening, suggesting the pace of buying may be easing.
4/5 Meanwhile, the MACD has printed a golden cross, which is another sign that Solana may be approaching a bullish breakout. pic.twitter.com/a1lnQXcefC
— Ali Charts (@alicharts) August 9, 2026
Immediate support sits close to $76, followed by the more critical $75 level. A drop below $75 would weaken the rising channel and expose $74. Further selling could bring the stronger $72 support back into focus.
Broader market conditions also factor in. Bitcoin has tested the $65,000 area, while Ethereum has held above $1,900. On the regulatory front, the Senate has pushed further CLARITY Act consideration beyond the August recess. The bill, which would establish a clearer division of regulatory authority over digital assets between the CFTC and SEC, remains a key variable for crypto markets that have been pricing in the prospect of friendlier rules. Senate Majority Leader John Thune filed a procedural motion setting up consideration after lawmakers return.
Solana ETF Flows Stall as Assets Approach $870 Million
United States spot Solana ETFs recorded no fresh inflows on August 7, according to SoSoValue data. Total net assets stood near $869.97 million, representing approximately 2.02% of Solana's market capitalization. Historical net inflows held near $1.15 billion, while combined trading value reached roughly $40.63 million.
Bitwise's BSOL led the category with about $594.45 million in assets and $27.48 million in daily trading. Fidelity's FSOL followed with $125.41 million, while Grayscale's GSOL held approximately $96.81 million. All listed products recorded zero daily inflows, although most fund prices gained more than 1.6% during that session.
SoSoValue's broader crypto ETF tracker has recently placed aggregate Solana ETF assets near the same $870 million area. Daily flows can pause even when product assets remain elevated — a distinction that matters when traders assess institutional demand alongside short-term price movement. A single session of zero inflows does not necessarily signal waning interest, but sustained flat readings would mark a contrast with the early accumulation phase that built the historical $1.15 billion inflow figure.
Key Levels Ahead
The next technical test remains concentrated around $78 and $78.70. Holding above $76 would preserve the immediate higher-low setup. A clean breakout could bring $80 and $82 into view, while the wider channel leaves $100 as a conditional target. Failure below $75 would shift attention back toward $74 and $72.

