Solana Price Repeatedly Defends $100 as Fibonacci Level and 100-Day SMA Converge
Key Takeaways
- •The $100 price level coincides with Solana’s 0.382 Fibonacci retracement and has repeatedly held on a daily-closing basis.
- •Solana’s next major support is the rising 100-day SMA near $97.7, while a break below it could shift attention toward $92.3.
- •The main resistance zone is $109.4–$109.5, where the 0.236 Fibonacci retracement and 50-day SMA nearly overlap.
- •SOL remains below its broken rising trendline and 50-day SMA, so holding $100 alone would not confirm that the correction has ended.
- •Further downside levels include the 200-day SMA near $88.8 and the 0.618 Fibonacci retracement around $84.7.
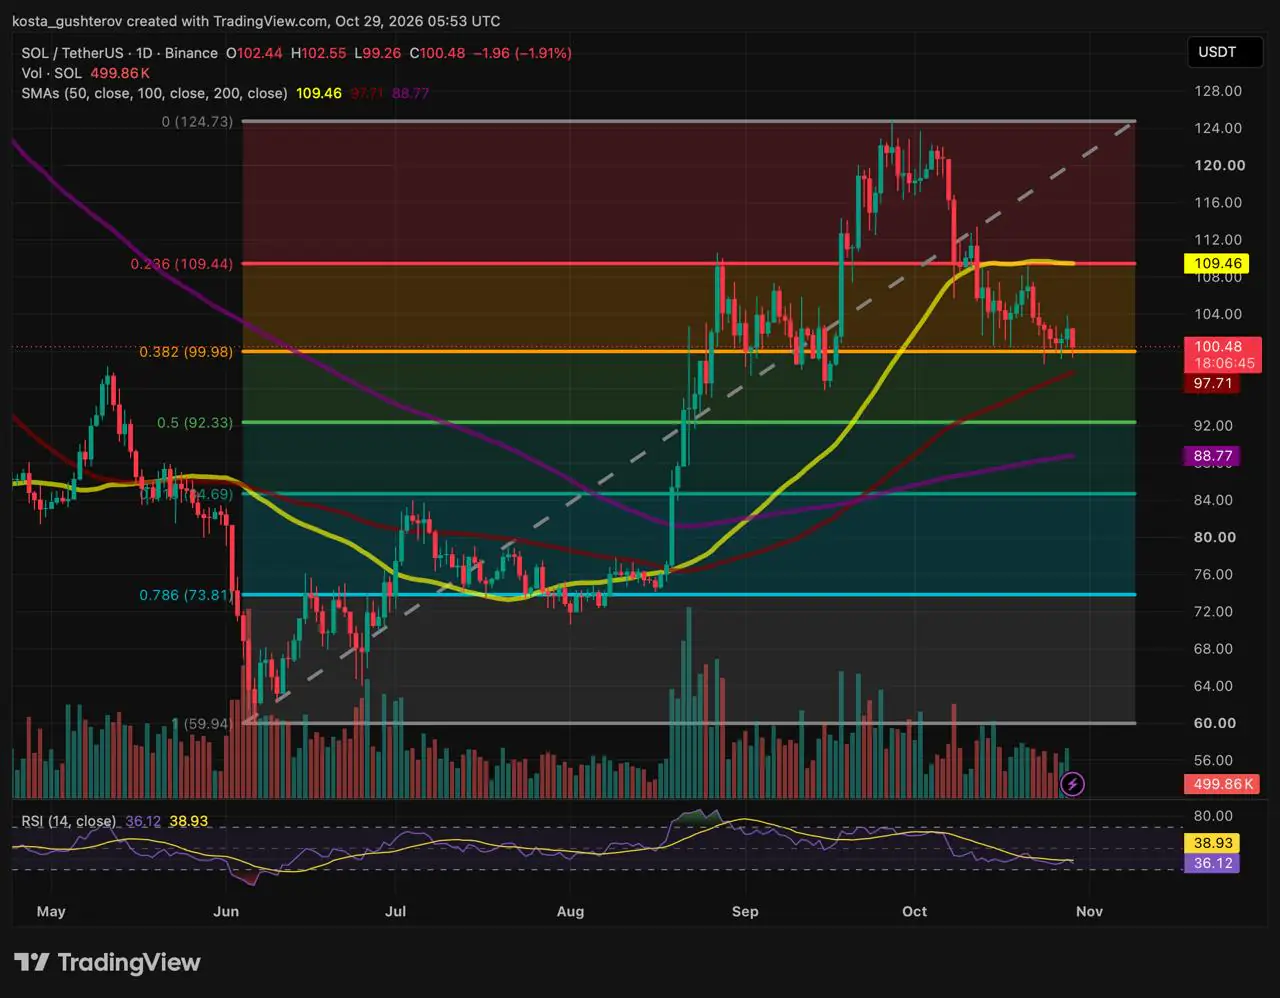
Solana (SOL) traded around $100.5 on the SOL/USDT daily chart, down about 1.9% on the session after swinging between an intraday low of $99.3 and a high of $102.6. The $100 mark has now come under pressure repeatedly, with recent dips below the round number ending in daily closes back above it.
Why $100 Is Carrying Double Weight
Solana's pullback from its $124.7 swing high has returned the price to the 0.382 Fibonacci retracement of the advance that began near $59.9 — a calculated level that lands at almost exactly $100. Fibonacci retracements measure how much of a prior move has been given back at standard ratios, and 0.382 is the shallowest of the retracement rungs on this chart, with the pullback so far surrendering roughly that share of the climb from $59.9 to $124.7. When a technical level and a round number coincide, the confluence tends to draw more orders than either would on its own, which helps explain why the recent dips below $100 have consistently ended with daily closes back above it.
The current daily candle has again traded under $100, briefly touching $99.3. It remains open, however, so the intraday recovery says nothing yet about where the day will ultimately settle. For anyone tracking the level, the daily close is the data point that counts here, since the pattern of repeated saves described above is defined by closing prices rather than intraday wicks.
Just beneath the round number sits a second layer of support: the rising 100-day simple moving average (SMA) near $97.7 — a measure that smooths out roughly the past 100 days of daily closes and serves as a common gauge of whether a longer-term trend remains intact. If $100 gives way for a session, the moving average is the next line standing between SOL and a deeper retracement. A daily close beneath it — particularly one that buyers fail to reclaim — would remove the backstop that lends the current floor its credibility.
The Level Structure Is Asymmetric
Measured from $100.5, the levels on either side of the price are not evenly spaced. The distances to each are as follows:
| Level | Description | Distance from $100.5 |
|---|---|---|
| $100 | 0.382 Fibonacci retracement | -0.5% |
| $97.7 | 100-day SMA | -2.8% |
| $104 | Early recovery threshold | +3.5% |
| $92.3 | 0.5 Fibonacci retracement | -8.2% |
| $109.4–$109.5 | 0.236 Fibonacci retracement + 50-day SMA | +8.9% |
That imbalance is the core of the chart. A daily close below $97.7 sits less than 3% away and would change the technical picture quickly. Reversing the damage of the pullback, by contrast, means recovering a resistance cluster nearly 9% higher. Until one of those outcomes materializes, SOL is trading in the space between a near floor and a distant ceiling.
The Upside Path
- $104 (+3.5%) — An early sign that price has put distance between itself and support, though the level carries little technical weight of its own.
- $109.4–$109.5 (+8.9%) — The 0.236 Fibonacci retracement and the 50-day SMA almost overlap here, making this the main resistance cluster.
- $124.7 (+24%) — The previous swing high, which remains a distant reference until the cluster is cleared.
The Downside Path
- $100 and $97.7 (-0.5% / -2.8%) — The 0.382 Fibonacci retracement and the rising 100-day SMA, the immediate support layers.
- $92.3 (-8.2%) — The 0.5 Fibonacci retracement, a reference point rather than a guaranteed floor.
- $88.8 and $84.7 (-11.6% / -15.7%) — The 200-day SMA and then the 0.618 retracement, which together form a wider support area.
What a Rebound Would Have to Clear
Solana remains below the rising trendline it broke during the pullback and below its 50-day SMA, so even a bounce from $100 would start from a technically weak position. A move back above $104 would create some distance between price and support, but that level carries little technical weight of its own.
The decisive test sits at $109.4–$109.5, where the 0.236 Fibonacci retracement and the 50-day SMA nearly overlap. Two levels clustered that closely tend to attract sellers, and a rebound that stalls there would leave SOL facing another test of $100. A sustained move above the cluster, followed by a pullback that holds on top of it, would be the first sign that the correction has run its course. Only after that would the $124.7 swing high become a realistic reference again.
If the Backstop Gives Way
A daily close beneath the 100-day SMA would turn attention to the 0.5 retracement near $92.3, the next calculated level on the chart — a reference point rather than a guaranteed floor. Below that, two levels form a wider support zone: the 200-day SMA near $88.8 and the 0.618 retracement around $84.7. In a continued decline, the 200-day average would be the first of the two to come into play.
Scenarios From $100
Upside: Daily closes holding above $100 and a recovery of $104 could open the way toward the $109.4–$109.5 cluster, where a sustained break and a successful retest would be needed before $124.7 comes back into view.
Downside: A daily close below $97.7 that buyers fail to reclaim could expose the 0.5 Fibonacci level near $92.3, with the 200-day SMA near $88.8 and the 0.618 retracement around $84.7 beneath it.
Bigger picture: Holding $100 would not, by itself, end the correction. With SOL trading below its broken trendline and its 50-day SMA, the chart only improves meaningfully once the $109.4–$109.5 resistance cluster is cleared.
This article is provided for informational purposes only and does not constitute financial or investment advice. Technical levels and scenarios do not guarantee future price movement.
Source: Coindoo — Solana Price Keeps Saving $100 at the Last Minute

