Solana Targets $90 Breakout as Momentum Strengthens
Key Takeaways
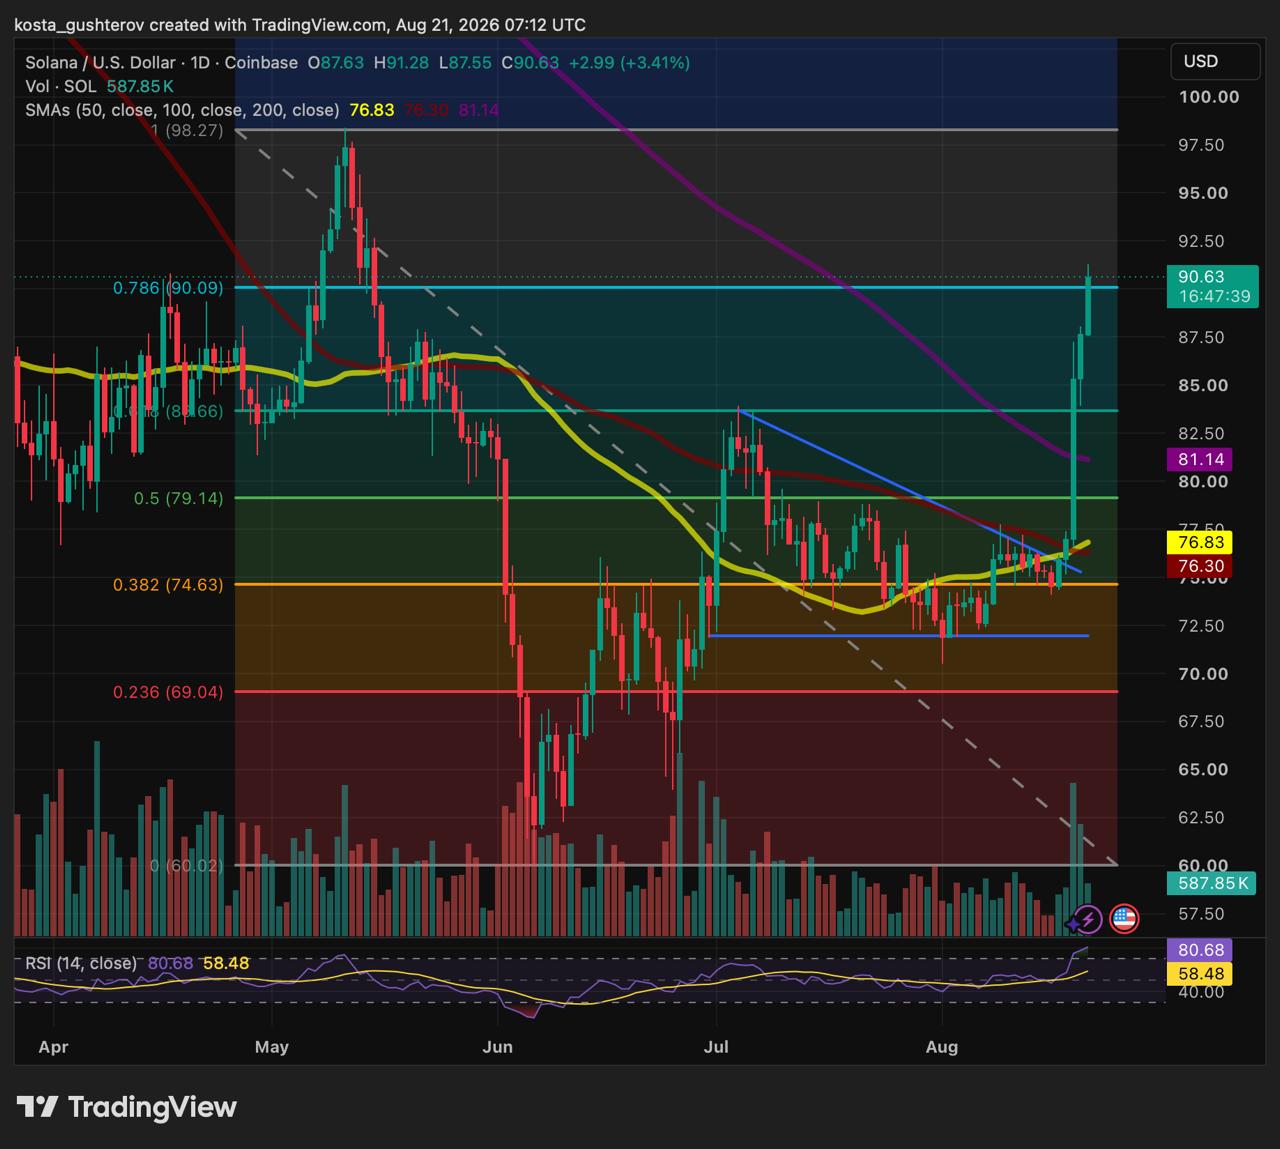
- •SOL traded at $90.6 after reaching an intraday high of $91.3, testing the 0.786 Fibonacci retracement near $90.
- •A daily close above $90 is viewed as the key confirmation that buyers are absorbing supply at this resistance area.
- •If the price pulls back, $83 is the nearest support, while $74.6-$76.8 forms a deeper multi-indicator support shelf.
- •The daily RSI was 80.68, indicating the rally was in overbought territory and may need a pause or retest.
- •Solana has started the first phase of SIMD-0525, which aims to reduce target slot times from 400 milliseconds to 200 milliseconds in stages.
Key Takeaways
- $90: The immediate 0.786 Fibonacci resistance and psychological target.
- $83: The 0.618 Fibonacci level and nearest baseline support for minor pullbacks.
- $74.6-$76.8: A critical multi-indicator support shelf combining several technical levels.
Coinbase daily charts show SOL trading at $90.6 after reaching an intraday high of $91.3, placing the token directly against the 0.786 Fibonacci retracement and a psychological barrier near $90.
The move marks a notable shift in short-term structure. After defending the 0.618 retracement at $83 and reclaiming the 200-day SMA at $81, along with the 50-day and 100-day moving averages near $76, the key question is whether bulls can secure a daily close above $90 rather than a brief intraday wick.
The daily close is the deciding factor
Measured from the $60 swing low to $98, the chart places the 0.786 retracement at roughly $90. Fibonacci retracements divide the vertical distance between a swing low and a swing high into ratio-based zones; the 0.618 line — often called the golden ratio — is among the most widely watched retracement markers, while deeper readings such as 0.786 sit in late-stage territory where most of a prior decline has already been recovered. Because this is a late-stage resistance level, with most of the prior decline already recovered and the initial momentum already spent, intraday spikes matter far less than where the daily candle settles.
A confirmed daily close above $90 would show buyers are absorbing supply at these levels. By contrast, a rejection that leaves a long upper wick would suggest exhaustion, particularly after such a rapid advance.
Momentum indicators underscore the strength of the rally. The daily RSI stands at 80.68, well above the 70 overbought threshold. The Relative Strength Index compares the size of recent gains against recent losses on a 0-to-100 scale, and readings above 70 have traditionally signaled stretched upside momentum. While an elevated RSI is not an automatic sell signal, it suggests the price may need to pause or retest lower support before attempting a sustained move toward the $98 swing high.
Support levels to watch if SOL pulls back
If the market retraces, traders are watching two distinct defense zones. The first is $83, the 0.618 Fibonacci level that served as the launchpad for the latest leg higher. Holding that area would keep the near-term uptrend intact.
Below that sits a heavier, multi-layered support shelf. The 50-day SMA at $76.83, the 100-day SMA at $76, and the 0.382 Fibonacci retracement at $74.6 converge tightly in the $74-$76 range, alongside the descending trendline that capped SOL’s price action through July and early August.
That confluence makes the $74.6-$76.8 band a critical floor. A move back to $83.6 would represent only a modest pullback, but losing the $76 area would significantly weaken the broader recovery structure.
Faster slot times provide a technical backdrop
The price action comes as Solana begins the first phase of SIMD-0525, a protocol upgrade designed to reduce target slot times from 400 milliseconds to 200 milliseconds across four stages. The initial target is set at 350 milliseconds, and Anza’s feature tracker shows active mainnet feature gating. SIMDs — Solana Improvement Documents — are the network’s formal process for proposing and gating protocol changes, and Anza is the engineering firm behind the Agave validator client. Slot time is the interval at which Solana produces new blocks, so the staged reduction targets how quickly transactions receive initial confirmation rather than raw capacity.
The performance upgrade offers a supportive fundamental backdrop, but it should not be treated as a direct pricing formula. The protocol combines faster block cadence with adjusted per-slot work limits to keep aggregate processing stable. Even so, improving expectations around network performance can help traders press technical boundaries before the upgrade’s full on-chain impact is reflected in the data. Beyond the opening 350-millisecond stage, the remaining steps toward the 200-millisecond target are the next verifiable rollout milestones to watch alongside the chart levels.
From weak summer levels to structural recovery
The current setup is a sharp contrast to late June, when SOL was trading near $71 below all major moving averages, a period in which analysts identified $65 as the key downside pivot. A clean recovery above the 50-day, 100-day, and 200-day averages indicates the current rally is more than a routine relief bounce.
For now, Solana’s near-term outlook is defined by three levels: a daily close above $90, support at $83.6 on minor dips, and the $74-$76 shelf as the broader trend’s main safety net.
Source review: Price levels, Fibonacci markers, moving averages, and RSI readings are based on the supplied TradingView Coinbase SOL/USD daily chart captured on August 21, 2026. Upgrade details are drawn from the official SIMD-0525 documentation and Anza’s feature-gate tracker. This article is for informational purposes only and does not constitute investment advice.

