Solana Holds Above $75 as ETF Inflows Extend to Seven Weeks and Bullish Wedge Forms
Key Takeaways
- •SOL traded at $75.27, down about 0.1% over 24 hours, after finding support near an ascending trendline.
- •US-listed spot SOL ETFs recorded $10.26 million in inflows last week, marking a seventh straight week of positive flows.
- •Analysts highlighted a falling wedge on SOL’s 4-hour chart, a pattern that can precede an upside breakout if confirmed.
- •The token is trading just above its 50-day EMA at $75.48, while the 100-day and 200-day EMAs at $78.10 and $88.69 remain overhead resistance.
- •MACD momentum is improving, but SOL has not yet confirmed a breakout, with $77.10 as the first upside target and $71.91 as nearby support if $74.50 fails.
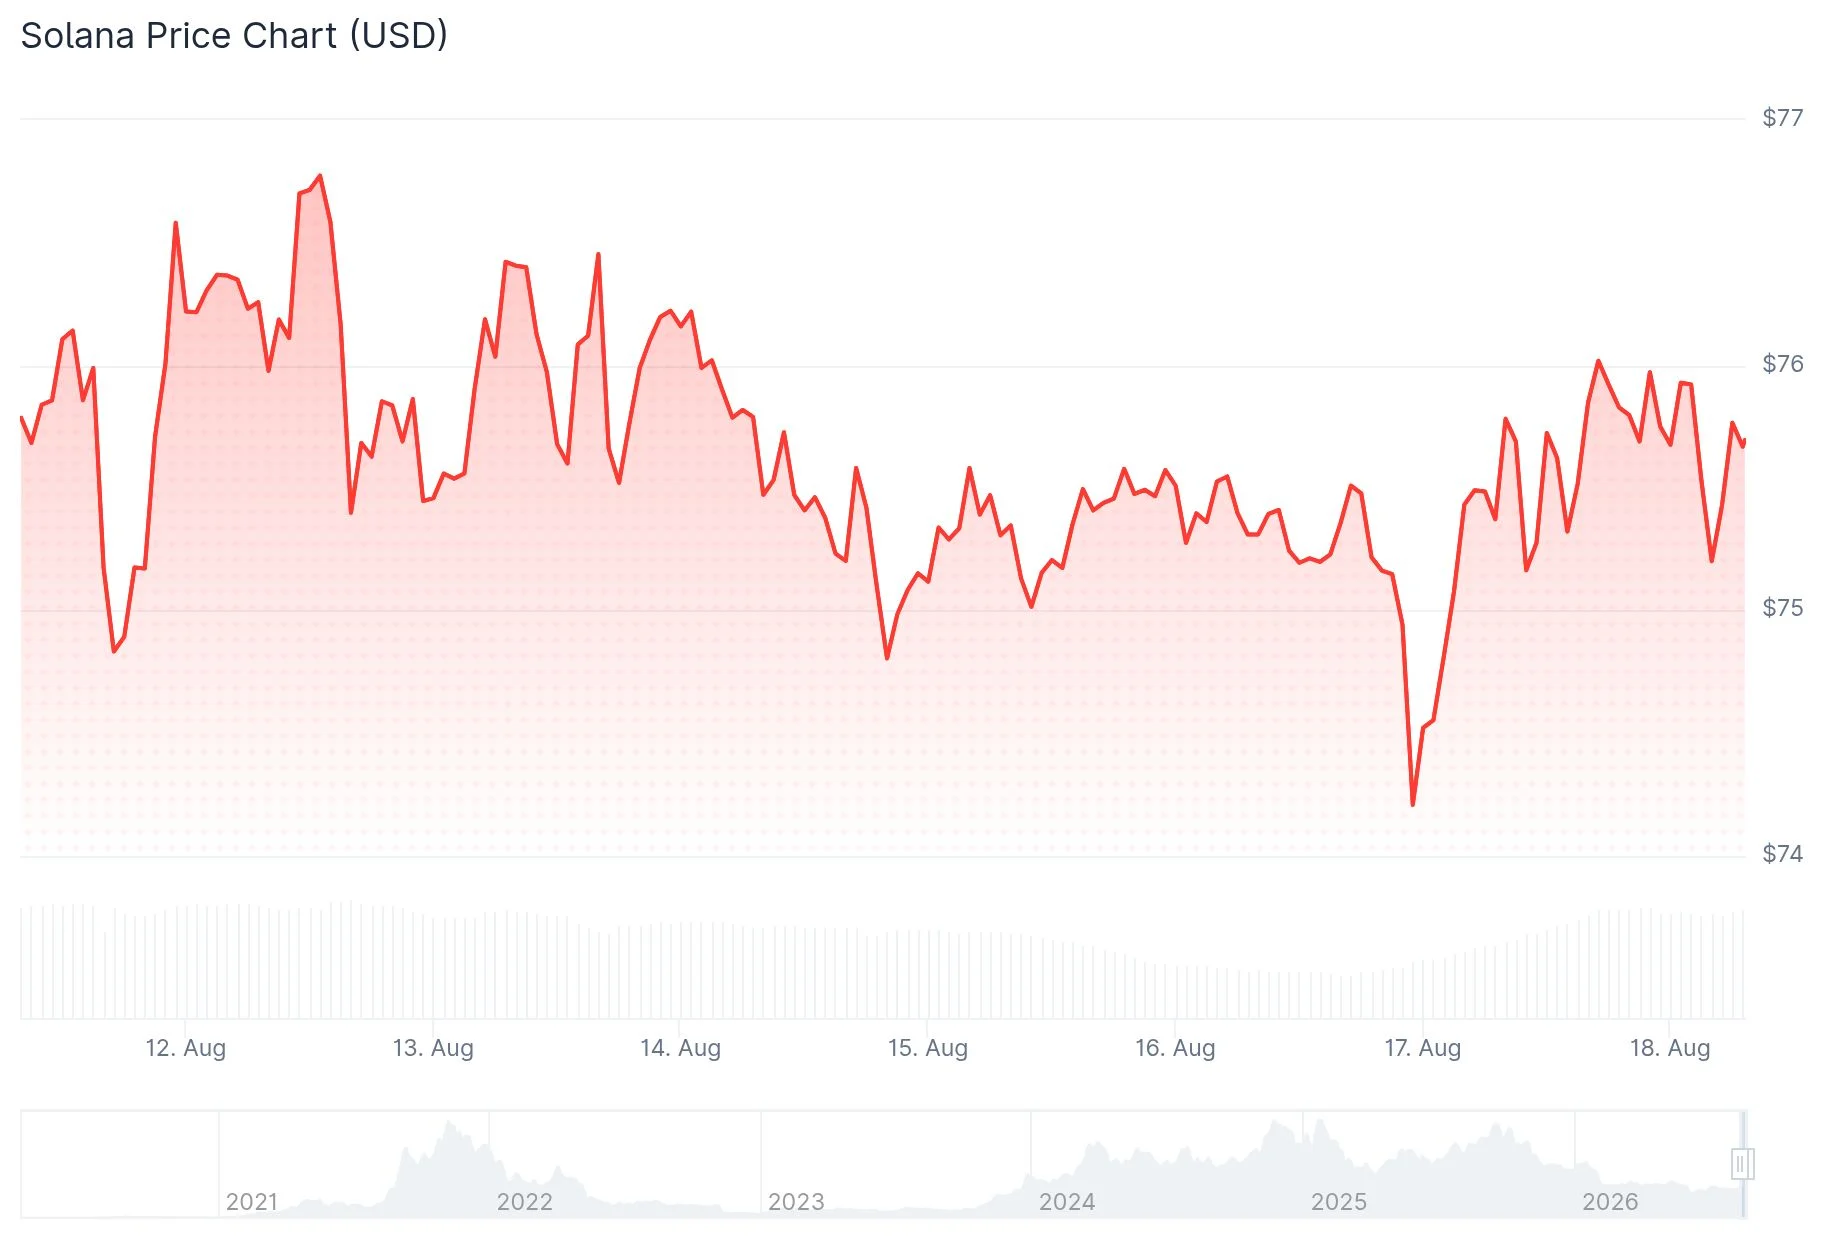
Solana is holding above $75 as technical indicators and steady institutional inflows continue to support the token. SOL traded at $75.27 at the time of writing, with 24-hour volume of about $2.27 billion and a market capitalization of approximately $43.86 billion. The token was down about 0.1% over the previous 24 hours.
The price found support at an ascending trendline after falling 2.18% last week. SOL is trading just above the 50-day Exponential Moving Average (EMA) at $75.48, a level traders often watch as a short-term gauge of momentum.
Analyst Bluntz, posting on X, said there was “strong pa on $SOL,” adding that the token has been “somewhat boring” because it is likely still in an accumulation phase. He said a weekly bullish divergence may be marking the bottom.
strong pa on $SOL here, liking it alot, its been somewhat boring because we are likely still in an accumulation period but ppl have already conveniently forgotten theres a weekly bull div there likely marking the bottom pic.twitter.com/WQZCJ4zaOG — Bluntz (@Bluntz_Capital) August 11, 2026
ETF inflows remained positive for a seventh straight week. According to SoSoValue data, US-listed spot SOL ETFs recorded $10.26 million in inflows last week, the highest weekly total since May 22. That marked the seventh consecutive week of positive flows, keeping attention on whether demand from these products can continue to offset short-term price pressure.
CryptoQuant data also points to a mild bullish tilt, with large whale orders visible in spot markets and cooling conditions in futures. Other on-chain metrics remain neutral.
The 100-day EMA is at $78.10, while the 200-day EMA stands at $88.69. Both levels are overhead resistance and keep the broader trend range-bound for now.
On August 17, analysts at Alpha Crypto Signal flagged a falling wedge forming on SOL’s 4-hour chart. The pattern shows price compressing between two descending trendlines, a setup that often comes before an upside breakout.
Thoughts on #SOL : $SOL is forming a falling wedge on the 4H chart, with price compressing between descending trendlines. The recent bounce from the lower boundary keeps the setup interesting, but confirmation is still needed. A clean breakout above the upper trendline could… pic.twitter.com/RBWgi1JTu1 — Alpha Crypto Signal (@alphacryptosign) August 17, 2026
SOL is trading near the mid-Bollinger Band at $74.50. The upper band is at $77.10 and the lower band is at $71.91.
The MACD histogram is at 0.10329, with the MACD line at 0.05374 and the signal line at -0.04955, indicating improving momentum.
A clean move above the wedge’s upper trendline, supported by higher volume, would put $77.10 in focus as the first upside target. If SOL fails to hold $74.50, the near-term setup would weaken and $71.91 would come into view. The token has not yet confirmed a breakout, leaving the combination of ETF flows, momentum indicators, and nearby resistance levels as the main factors to watch in the next few sessions.

