Solana ETFs Post Slim Weekly Gain as Inflows Collapse 97% and SOL Momentum Cools
Key Takeaways
- •Weekly net inflows into U.S. Solana ETFs fell approximately 97% to about $4.9 million in the week ending September 4, from roughly $142.7 million the previous week.
- •Only three of the six Solana ETF products (BSOL, FSOL and GSOL) recorded non-zero net flows, while the other three posted zero flow throughout the period.
- •On September 4, Solana ETFs logged a $5.2 million net outflow, while Bitcoin ETFs drew $174.6 million and Ethereum ETFs $25.9 million in net inflows.
- •CME data showed SOL long positions up 577 contracts and short positions down 1,210 contracts, but the figures exclude hedging positions, weakening the bullish interpretation.
- •The data reflect fading momentum rather than a confirmed investor retreat, and dollar totals are not adjusted for fund size or able to distinguish fresh capital from asset swaps.
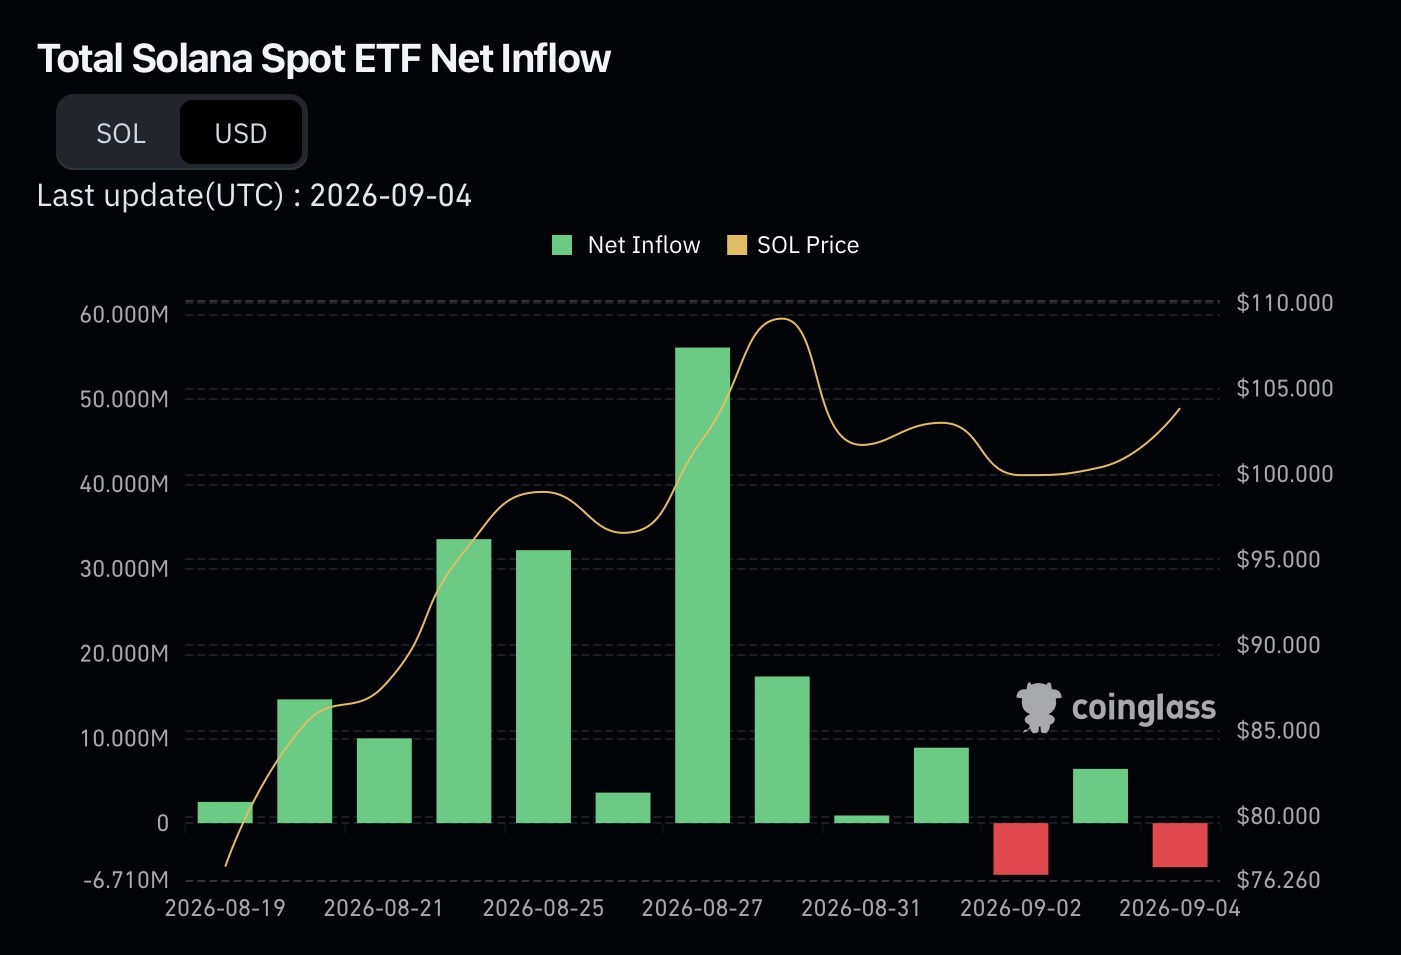
Weekly net inflows into U.S. Solana ETFs dropped roughly 97% to about $4.9 million in the week ending September 4, down from approximately $142.7 million over the previous five trading sessions.
The category remained net positive rather than flipping into an outright weekly outflow, a result that points to fading momentum rather than a confirmed investor retreat.
Solana ETF Flows Show a Narrow and Uneven Demand Base
Only three of the six Solana ETF products — BSOL, FSOL and GSOL — recorded non-zero net flows during the statistical period, while VSOL, TSOL and SOEZ posted zero net flow on every trading day covered, according to data tracked by Farside Investors and CoinGlass.
The week's fragile positive balance also masked a rough finish. On September 4 alone, Solana ETFs recorded a net outflow of $5.2 million, meaning the $4.9 million weekly figure survived only because inflows on earlier days offset that closing-session drain. The pattern echoes the momentum swing described in earlier coverage of Solana's record inflow run and the subsequent daily rebound tracked in reporting on Solana ETF flow recoveries.
These dollar totals carry structural limits worth flagging. The figures are not adjusted for each fund's assets under management, do not capture every crypto ETF product, and cannot distinguish fresh capital from investors simply swapping between assets. That last caveat matters particularly for Solana, a relatively young ETF category whose products are still small in asset terms compared with the Bitcoin and Ethereum fund bases, so even modest dollar moves can swing weekly percentages sharply.
Bitcoin Leads the Cross-Asset ETF Allocation Comparison
𝗕𝗨𝗟𝗟𝗜𝗦𝗛: For all the talk of $BTC being boring, investors have quietly added another $1.9 billion to its ETFs in just two weeks. pic.twitter.com/tQTL3k3TSz
— Blockto (@TheBlocktoApp) September 7, 2026
On September 4, Bitcoin ETFs recorded $174.6 million in net inflows (CoinGlass), while Solana ETFs posted a $5.2 million net outflow. The daily split also showed Ethereum ETFs absorbing $25.9 million in net inflows during the same session.
That gap indicates that Bitcoin held the strongest incremental ETF allocation in this single-day comparison, a contrast to the multi-asset inflow streak covered in prior reporting on ETH, XRP and SOL fund demand. Importantly, the data do not prove investors rotated out of Solana and into Bitcoin, nor do they cover every crypto fund in existence. A larger dollar figure for Bitcoin ETF flows also does not automatically mean stronger demand relative to the size of Bitcoin's much larger fund base.
CME Positioning Offers a Qualified Signal
Derivatives data added a wrinkle to the demand picture without resolving it. CME Group data show SOL long positions rose by 577 contracts while short positions fell by 1,210 contracts, producing a lower net-short position overall.
That asymmetry looks bullish on the surface, but the underlying source is explicit that the reported long and short columns exclude positions classified as hedging. A smaller net short therefore cannot be attributed purely to funds actively covering bearish bets; it may just as easily reflect adjustments in hedging strategy among market participants with no directional conviction either way.
Read alongside the ETF slowdown, the CME shift becomes one more data point rather than a standalone bullish signal. Investors assessing whether SOL demand is genuinely expanding need to weigh both capital flows into ETF products and these derivatives-positioning changes together, not in isolation.
The Next Test Is Sustained, Broad-Based Demand
A single positive week, propped up by three of six products and a late-week outflow, does not establish a durable trend. The stronger evidence would be consecutive weeks of positive Solana ETF flows spread across a broader range of products rather than concentrated in a handful of names.
Comparing future flows against a stable asset base, rather than judging them purely on raw dollar totals, would help separate genuine demand growth from numbers inflated by fund size. Creation and redemption activity, along with subsequent shifts in CME long, short, options and hedging positions, will offer the clearer picture that a single week's Farside snapshot cannot provide.
Until that broader confirmation arrives, Solana's ETF story remains one of cooling momentum rather than reversal, as tracked in ongoing coverage of Solana ETF flow trends.
