Solana Price Pulls Back From Monthly High as SOL ETF Outflows Accelerate
Key Takeaways
- •Spot Solana ETFs have shed over $29 million in assets this month, a sharp reversal from the more than $271 million they added the previous month.
- •Rising US inflation above the Federal Reserve's 2% target and a ten-year yield at its highest level since 2002 have pressured risk assets, including cryptocurrencies.
- •Futures open interest declined to $6.92 billion from a $7.2 billion peak, while Solana's staked ratio fell to 68.7% from close to 70% earlier this month.
- •Solana's DEX protocols processed $74 billion in volume over the past 30 days, surpassing Ethereum's $44 billion, while the upcoming Alpenglow upgrade is expected to improve network speeds.
- •The formation of a golden cross pattern supports a bullish technical outlook, with a key target at $124 and further resistance at $150.
Solana's SOL token has reversed sharply this month, falling from a monthly high of $124.7 as outflows from spot Solana exchange-traded funds (ETFs) gain momentum. The pullback has coincided with weakness across the broader cryptocurrency market, with Bitcoin and popular altcoins such as XRP, Binance Coin, and Ethereum also under pressure. The central question for traders is whether the token will resume its uptrend or extend its downward move.
Key Points
- Solana's price has dropped over the past few days as SOL ETF outflows rise.
- Spot Solana ETF outflows have exceeded $29 million this month.
- The token has also formed a golden cross pattern, pointing to further gains, according to the source analysis.
ETF Outflows Point to Fading Demand
SOL has slipped as signs of waning demand emerge. One indicator is the performance of spot Solana ETFs, which are closely watched as a barometer of institutional appetite because creations and redemptions show directly how much capital investors are moving into or out of the asset through regulated wrappers. Data compiled by SoSoValue shows the funds recorded $3.7 million in outflows on Friday, with the bulk coming from Bitwise's BSOL ETF. BSOL remains the largest fund in the sector with $1.2 billion in assets, followed by Fidelity's FSOL, Grayscale's GSOL, and Morgan Stanley's MSOL.
In total, Solana ETFs have shed more than $29 million in assets this month — a major divergence from the trend of the previous three months. The funds added over $271 million in assets last month, well above the $193 million and $14.6 million they took in during August and June, respectively. A swing from steady accumulation to net withdrawals is precisely the kind of shift that flow watchers treat as evidence a demand trend has changed course.
Macro Pressures Weigh on Markets
The token's weakness has also coincided with growing investor concern over rising bond yields and inflation. Recent macroeconomic data from the United States showed that both headline and core inflation remained above the Federal Reserve's 2.0% target in August. Inflation is likely to stay above that threshold for the foreseeable future, owing to rising energy prices, with diesel hovering near its all-time high.
Soaring inflation has driven bond yields higher, with the ten-year yield rising to its highest level since 2002. That matters for crypto because higher yields lift the risk-free return available on government debt, which can make riskier assets such as cryptocurrencies comparatively less attractive to portfolio allocators. These conditions have elevated concern among investors, which partly explains the ongoing weakness in both the crypto and bond markets.
Derivatives and Staking Activity Cool
The same softening trend is visible elsewhere in the Solana ecosystem. Futures open interest — the total value of outstanding derivative contracts and a common gauge of leveraged participation — has dropped to $6.92 billion, down modestly from last month's high of $7.2 billion, a sign that demand among leveraged traders has started to fall.
Staked Solana has also edged lower in recent days. There are now 437 million staked SOL tokens, and the staked ratio has fallen to 68.7%, down from close to 70% earlier this month. The staked ratio tracks the share of SOL supply committed to securing the network in exchange for rewards, making it a widely followed measure of how much of the token's float is locked into network operations.
Fundamental Strengths Remain
On the positive side, the report identifies several factors that could support Solana's performance over time. The network is working on the upcoming Alpenglow upgrade, which is expected to deliver improved speeds and position Solana as one of the fastest layer-1 networks in the industry — a development that offers a fundamental counterpoint to the near-term flow data.
Solana is also gaining market share in the decentralized exchange (DEX) sector. Data shows that DEX protocols on the platform have handled $74 billion in volume over the last 30 days, well above Ethereum's $44 billion. Base and Robinhood Chain processed $30.3 billion and $43 billion, respectively. Because DEX volume is often used as a proxy for on-chain activity, that gap helps explain why Solana remains a focal point among layer-1 networks even as its token cools.
Technical Analysis: Golden Cross Forms
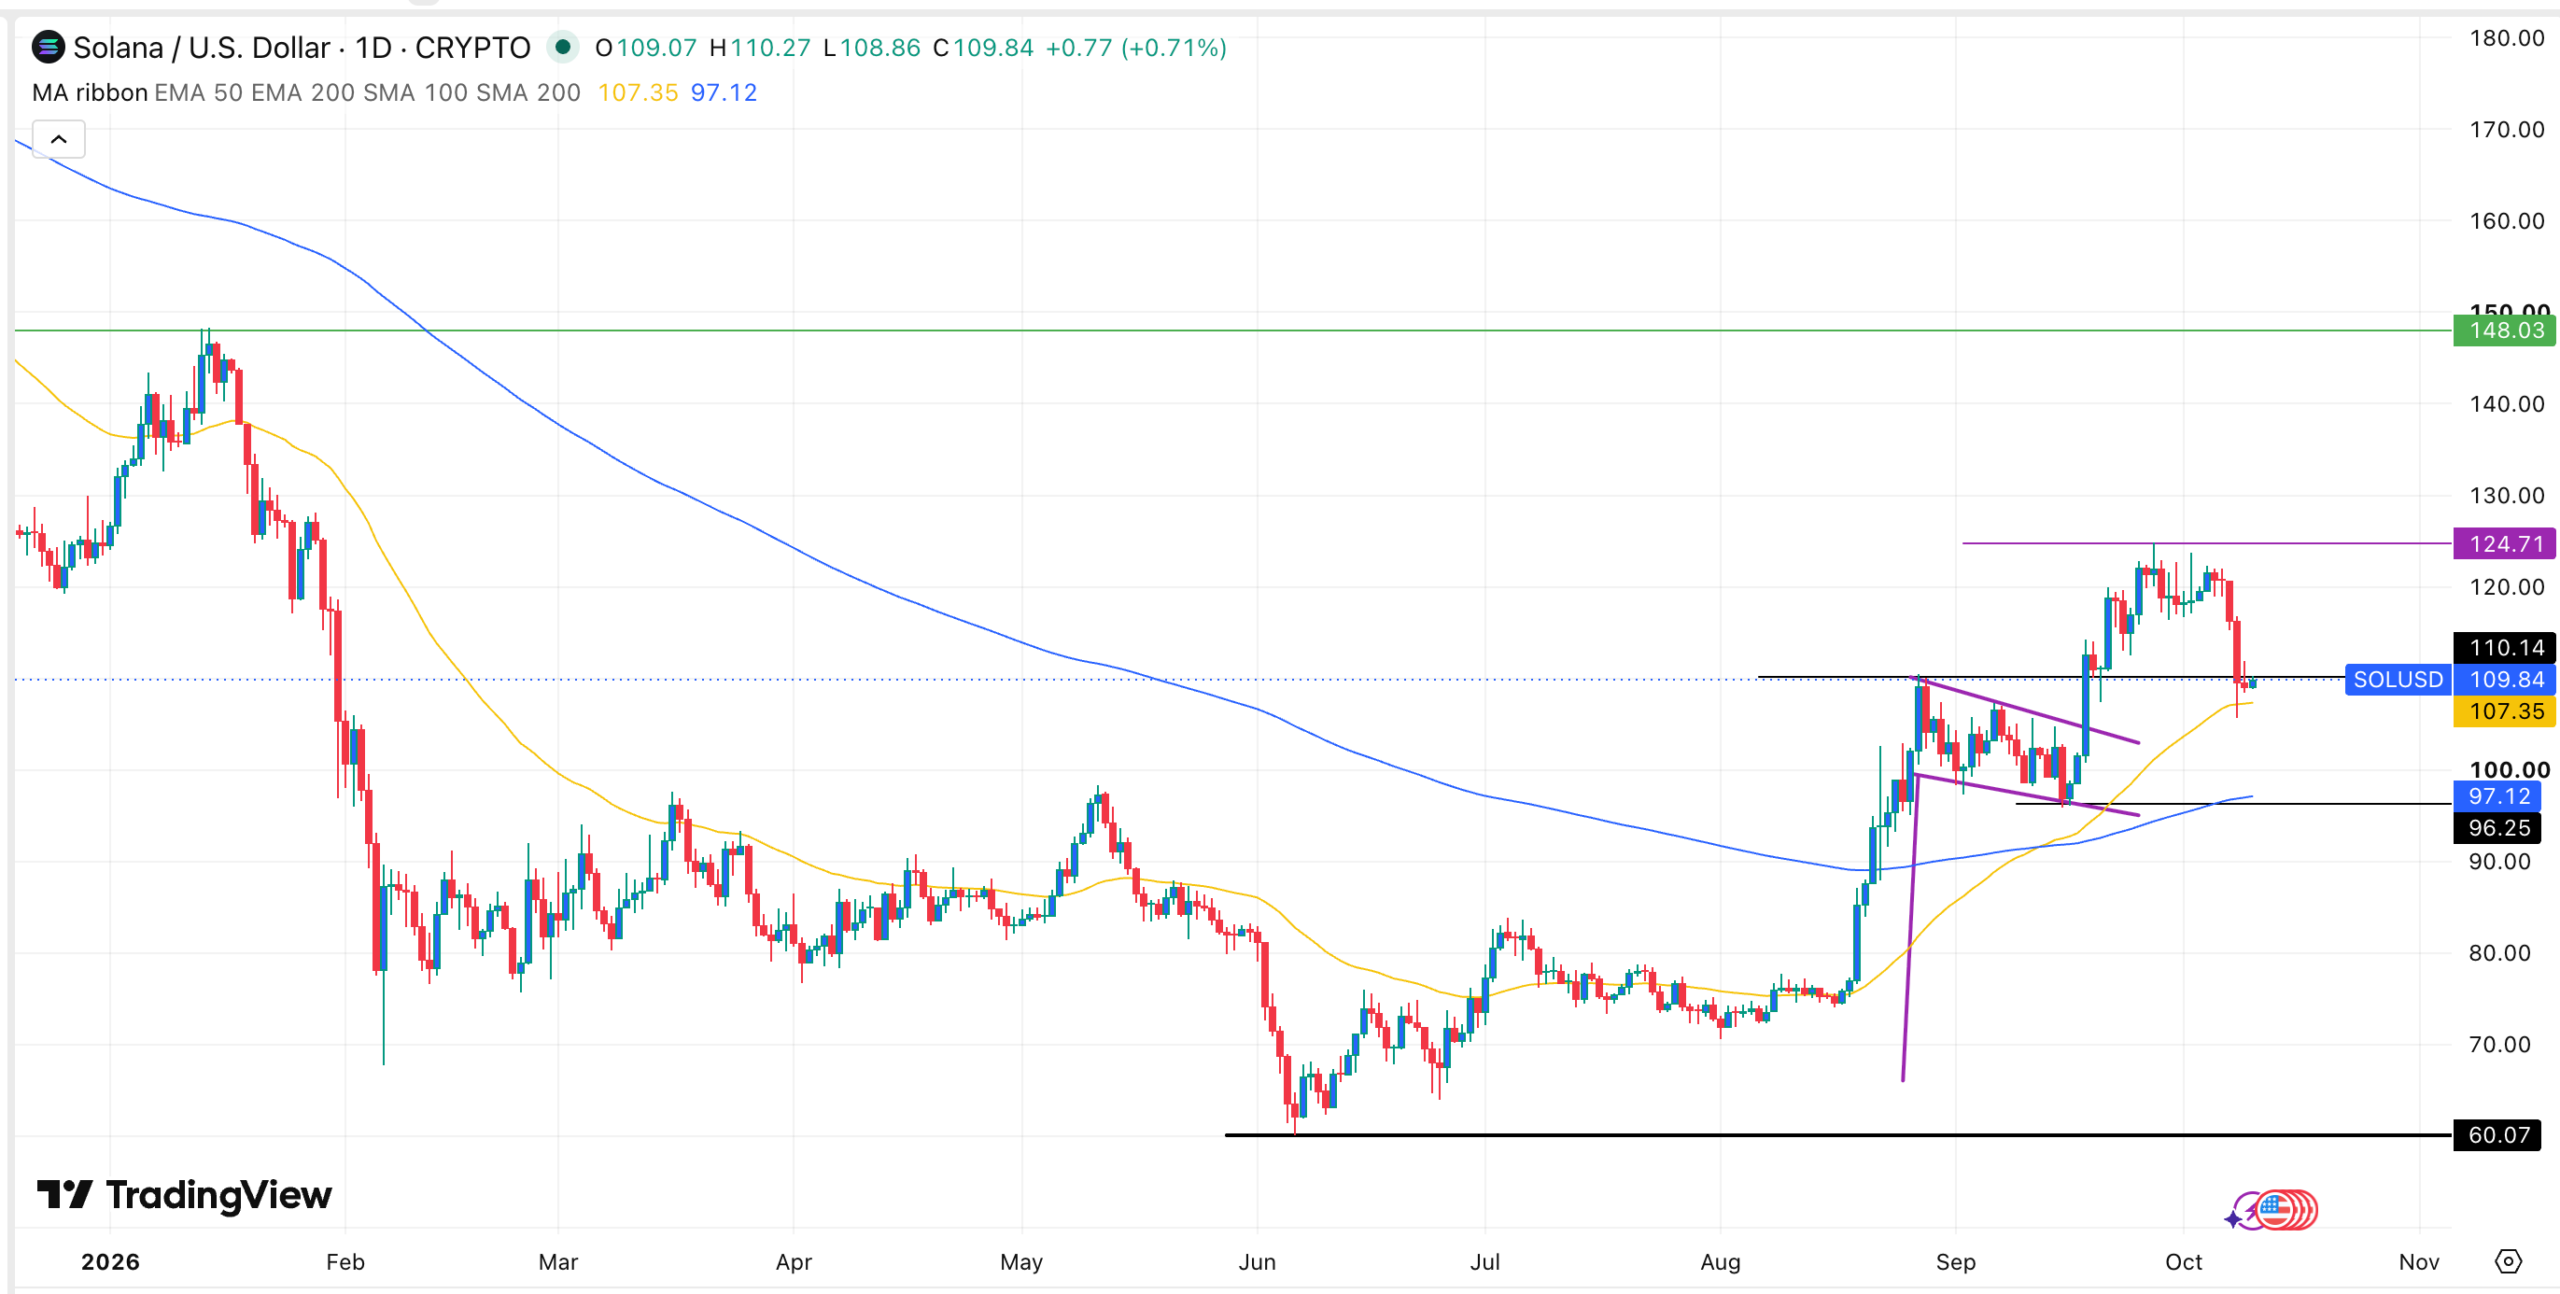
The daily chart shows that SOL rebounded from $60 in June and reached a high of $124 earlier this month. It then pulled back and retested the important support level at $109 — its highest point in August and the upper side of a bullish flag pattern — the kind of level traders typically monitor to judge whether a broader uptrend remains intact.
The token has remained above all of its moving averages and has now formed a golden cross pattern, a setup in which a shorter-term moving average crosses above a longer-term one and is traditionally read as a bullish momentum signal. Based on this setup, the analysis concludes that the most likely SOL price forecast is bullish, with the next key target at $124. A surge above that level would point to further gains toward the resistance level of $150. How ETF flows evolve, how upcoming inflation prints land, and how the Alpenglow rollout progresses will shape the tug-of-war between the souring demand picture and the bullish chart structure described in the analysis.

