Solana (SOL) Breaks Out of Falling Wedge Pattern as Analysts Map Path Toward $100
Key Takeaways
- •Solana broke above a falling wedge resistance near $74–$75 and was trading at approximately $76.29, up 1.90% over the preceding 24 hours.
- •US spot Solana ETFs recorded zero daily inflows on August 7, with total assets under management standing at $869.97 million across all products.
- •Bitwise's BSOL held the largest share of Solana ETF assets at $594.45 million, followed by Fidelity's FSOL at $125.41 million and Grayscale's GSOL at $96.81 million.
- •Analysts have identified several upside price targets for SOL, with immediate resistance at $77–$79 and further targets extending toward $82.25, $98.40, $114.55, and $130.70.
- •The Relative Strength Index for SOL was at 71.14, indicating marginally overbought conditions, while the MACD line remained above the signal line, supporting a bullish technical reading.
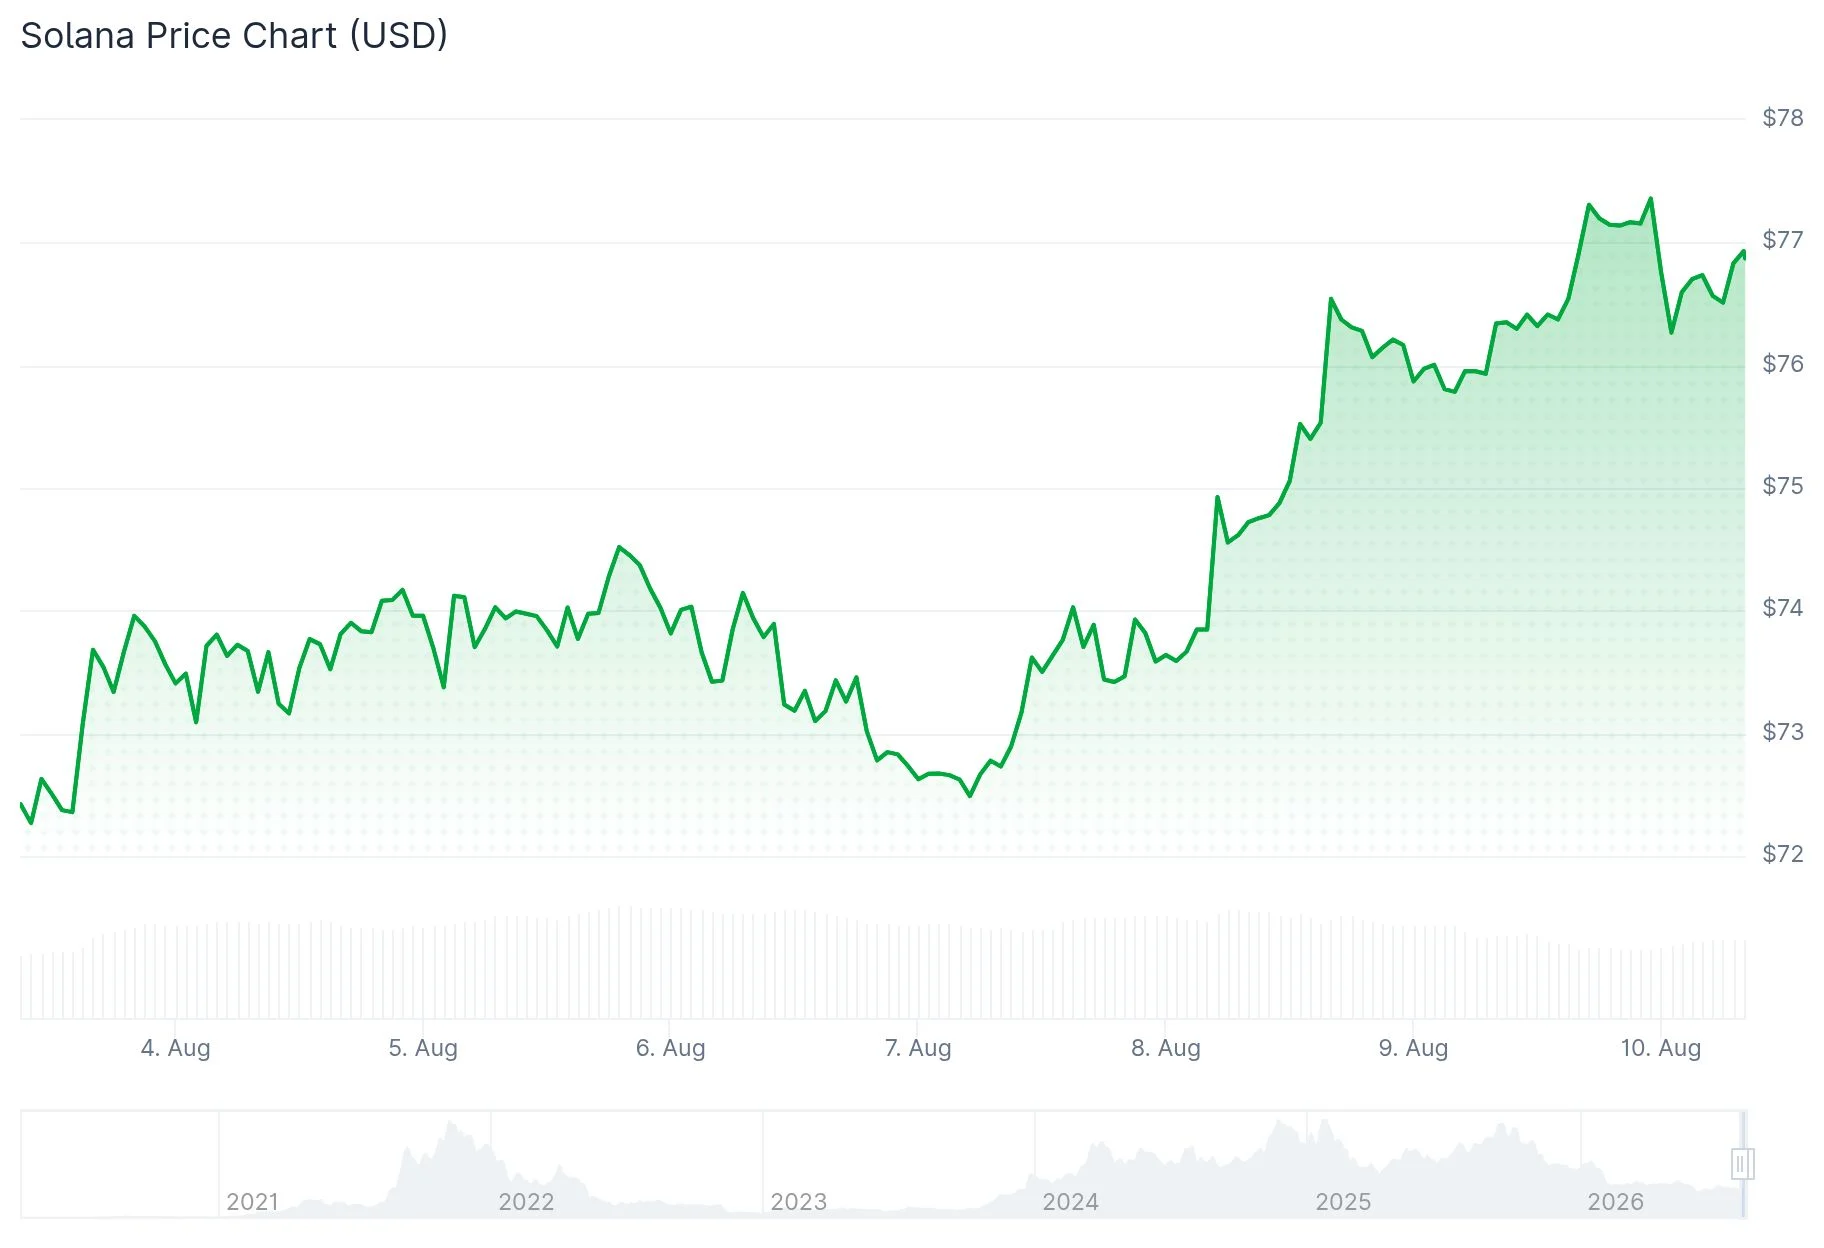
Solana (SOL) has broken out of a falling wedge pattern that had been forming since early July, pushing above the descending resistance line near $74–$75. At the time of writing, SOL is trading near $76.29, up approximately 1.90% over the past 24 hours. The move marks the first clean breakout outside the pattern in several weeks. Falling wedge formations are generally viewed by technical analysts as bullish reversal or continuation patterns, particularly when confirmed by rising volume, though breakout failures remain common.
Analyst CryptoJack highlighted the breakout on social media, noting that SOL pushed sharply through the resistance line. However, the move still requires follow-through to confirm the breakout.
The $77–$79 zone represents the next immediate resistance area. A sustained move through that range would bring the early-July highs of $82–$84 back into focus, with $80 serving as a nearby psychological target.
Analyst Daan Crypto Trades observed that SOL has been forming higher highs and higher lows since the June local bottom. He indicated that SOL needs to push only slightly higher to begin its next leg up, while cautioning that the broader market must hold steady for that scenario to unfold.
$SOL Attempting a breakout and break back above the green zone.
We have seen higher highs and higher lows since the June local bottom.
Just needs to push a little higher here and I think this starts the next leg up.
Obviously need the rest of the market to hold up for that. pic.twitter.com/Y5KvKGJ6dG
— Daan Crypto Trades (@DaanCrypto) August 8, 2026
ETF Flows Remain Flat
US spot Solana ETFs recorded zero inflows on August 7, according to SoSoValue data. Total assets stood at $869.97 million, representing 2.02% of Solana's market capitalization. Solana ETFs launched later than their Bitcoin and Ethereum counterparts, and the category's AUM remains a fraction of the billions held in BTC and ETH spot ETF products.
Bitwise's BSOL led the category with $594.45 million in assets. Fidelity's FSOL held $125.41 million, and Grayscale's GSOL held $96.81 million. All products reported zero daily inflows, though most recorded market price gains exceeding 1.6%.
Analyst Price Targets
Analyst TraderDaink outlined several upside levels should the current base develop into a sustained breakout. The first major target sits at $82.25, followed by $98.40, $114.55, and $130.70.
$SOL
Imagine the smell?
Nah I'm good, I don't want to smell shit from dumb bears pic.twitter.com/UgYTAw5ARx
— Daink (@TraderDaink) August 7, 2026
Analyst Gareth Soloway described the move as a classic wedge breakout with upside potential toward $100. He noted that the breakout becomes more convincing if SOL remains above the $74–$75 range. A move to $100 would first require clearing the $82–$84 zone and the $97–$98 resistance area.
Key Technical Levels
The Relative Strength Index (RSI) sits at 71.14, placing SOL marginally in overbought territory. An RSI above 70 typically signals that an asset may be overextended in the short term, though strongly trending assets can remain in overbought conditions for extended periods. The MACD line remains above the signal line, consistent with a bullish technical reading.
Solana needs to hold above $76 to maintain its short-term upward pattern. A drop below $75 would expose the $74 level, with stronger support sitting near $72. The current breakout structure remains intact as long as SOL holds above the low-$70s.

