Silver's Unsung Strength: Resilience After the Parabolic Collapse
Key Takeaways
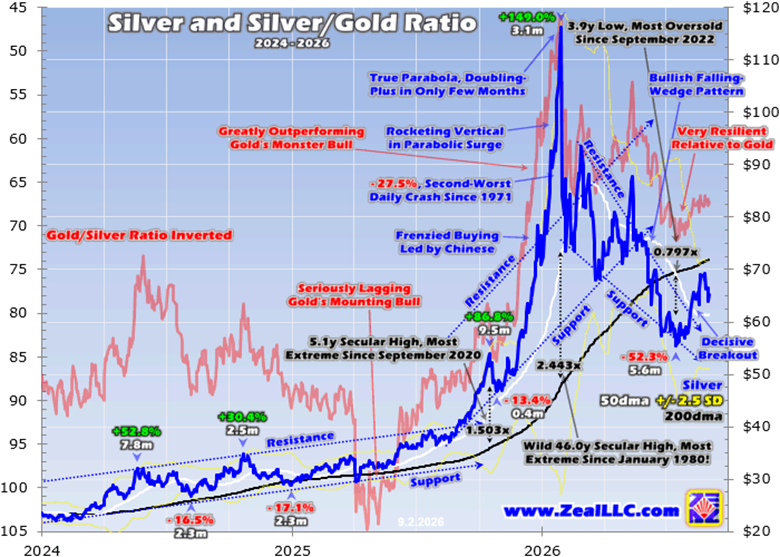
- •Silver peaked near $116 per ounce in late January 2026 after rocketing 149.0% in 3.1 months, then crashed 27.5% in a single day, its second-worst daily decline since 1971.
- •At its mid-July 2026 low, silver had fallen 52.3% over 5.6 months to above $55, which the author views as near best-case territory following an extreme parabola like the 1980 episode that ended in a 76.9% collapse.
- •Silver has averaged nearly $74 in 2026 to date, 116.7% higher than the comparable 2025 period, and was up 46.7% year-over-year even at its mid-July low.
- •The silver/gold ratio has averaged 65.4x since May 2026, representing silver's strongest showing relative to gold in about a dozen years outside the unsustainable parabolic episode.
- •The author's conservative scenario suggests that if gold rises 15% annually, silver could gain 30% or more per year, potentially more than doubling major silver miners' earnings within two years.
By Adam Hamilton | SilverSeek | September 4, 2026
Silver sentiment has felt apathetic to bearish recently, with traders wanting little to do with the metal. That is understandable after silver was more than cut in half earlier this year. Yet despite that perception, silver is showing considerable unsung strength. It weathered a dangerous post-parabola collapse relatively well and remains quite high compared with its own history and its primary driver, gold. Such resiliency is a bullish sign, argues the author.
In late January, silver skyrocketed alongside gold to an all-time high near $116 per ounce. That peak climaxed a spectacular bull run of 455.2% gains over 27.8 months, outperforming gold's parallel record cyclical bull by amplifying its gains 2.3x. Silver's performance was not uniform, however: it lagged gold early on before shooting parabolic near the end to catch up. That terminal moonshot was extreme — in just 3.1 months into late January's peak, silver catapulted 149.0% higher. Silver's tendency to amplify gold's moves in both directions reflects its dual character: like gold it trades as a monetary store of value, but it also carries substantial industrial demand, a mix that historically makes it more volatile than the yellow metal.
As the author warned in mid-January, about a week before silver's climax, that was a dangerous extreme parabola, defined through decades of studying market history as a doubling within two-to-three months following a massive bull run. Such one-sided, greed-fueled speculative-mania moves always end badly.
The infamous example from January 1980 illustrates the risk. Back then silver skyrocketed 196.1% in just 2.0 months into its peak; those levels would not be seen again until 31.3 years later in April 2011. By March 1980, just 2.2 months after the climax, silver had crashed 76.9%. The mid-January 2026 essay concluded with sober warnings: "Vertical moonshots are super-risky, nothing to be trifled with. ... Traders should avoid chasing silver's popular-speculative-mania gains, and gird for an imminent big-and-fast selloff."
A bit over a week later, silver stretched 144.3% above its key 200-day-moving-average baseline — a 46.0-year high in overboughtness, the most extreme reading since January 1980. A symmetrical collapse duly arrived with brutal violence: right out of late January's peak, silver crashed 27.5% in a single trading day, its second-worst daily crash dating back to 1971. The author analyzed the implications in another essay in mid-February.
The aftermath of January 2026's wildest extremes in nearly a half-century could have been far worse. Silver could have collapsed 75%+ in its post-parabola reckoning, which would have driven the price back near $29. Instead, at its worst in mid-July, silver fell 52.3% over 5.6 months, bottoming above $55. While a halving is a serious selloff, that outcome sits near best-case territory following an extreme parabola — evidence, the author argues, of genuine resilience.
At the mid-July post-parabola low, silver was down 21.9% year-to-date, which contributed to bearish herd sentiment. But that perspective is myopic, distorted by the post-parabola reckoning: even at that recent low, silver was still up 46.7% year-over-year. Despite the carnage in the half-year into mid-July, silver has averaged nearly $74 so far in 2026 — 116.7% higher than 2025's comparable year-to-date period into early September.
Sentiment feedback seen by the author, a financial-newsletter publisher for over a quarter-century, reflects this bearishness. Not a single subscriber e-mail in recent months has been bullish on silver; writers were generally disappointed by this year's collapse and expected the losses to continue mounting. Several weeks ago, after a long podcast discussion on gold, a host asked why silver is performing so poorly. The author responded that silver was faring well this year, showing impressive resilience relative to gold — a reply that surprised the host.
Maintaining perspective is everything in markets, because of the human tendency to extrapolate the latest moves into infinity. Psychologists have studied this in depth under names including recency bias, availability heuristic, and hyperbolic discounting. Overweighting the present emotionally impairs buying low and selling high. A few days, weeks, or even months of price action is insufficient context; the minimum is the past half-year — and following silver's extreme parabolic-spike anomaly, the frame should extend to the last few years.
Gold is silver's dominant primary driver, with gold's price action overwhelmingly fueling silver sentiment and trading. While the actual silver/gold ratio is a hard-to-parse decimal (0.015x midweek), the identical gold/silver ratio with an inverted axis is easier to read, running 67.3x Wednesday.
Had silver cratered by half in six months after a normal bull run, it would be catastrophic. But after rocketing 149.0% in 3.1 months to its most-overbought levels since January 1980, being cut in half is comparatively resilient; post-parabola losses out of nearly-half-century extremes could have again exceeded three-quarters.
In July, surrounding the post-parabola bottom, silver averaged a bit over $58 — still 55.0% above the comparable July-2025 average. Silver's performance this year only feels weak if judged myopically from late January's parabolic climax, levels that never had any chance of being sustainable.
Even during the post-parabola collapse, silver carved a massive bullish falling-wedge chart pattern, just like gold's parallel one. Such patterns tend to resolve in strong upside breakouts, which indeed happened in gold, its miners' stocks, and silver. Silver's decisive breakout followed the depth of its mid-July bottoming: a bit over $55, silver had plunged to just 79.7% of its 200-day moving average — a 3.9-year low, its most oversold reading since September 2022, more than a year before its monster bull got underway. The 52.5% selloff over 5.6 months had eradicated the hyperbolic herd greed of the parabolic climax, resetting the technical and sentimental stage, in the author's view, for another big bull run.
Silver's unsung strength is most apparent in the silver/gold ratio, which is not widely followed. From January 2020 to September 2023, just before silver's late bull got underway, the SGR averaged 81.7x — meaning it took 81.7 ounces of silver to equal the value of one ounce of gold, very poor historically against longer-term averages around 55x to 60x. From October 2023 to October 2025, during silver's late bull before its final three parabolic months into late January 2026, the SGR was even worse, averaging 87.3x. As the SGR line showed, silver seriously lagged gold's record bull for the great majority of its duration — the author notes he rarely wrote about silver back then, as it remained the precious-metals pariah.
The three months into silver's parabolic peak and the three months after were an extreme anomaly, with SGR reads averaging 66.5x on the way up and 62.0x on the way down — not representative of anything sustainable. What came since reveals the strength: starting in May, over the latest four-plus months, as silver sentiment languished and its price was sliced in half, the SGR still averaged 65.4x. With the brief exception of the unsustainable parabola, silver has not been this strong relative to gold since mid-2014 — its best showing versus gold in a dozen years despite the post-parabola collapse. For readers new to the metric: the ratio has historically ranged from roughly 30x at silver's most extreme strength in early 1980 to over 100x when silver is deeply out of favor, so a reading in the mid-60s sits well inside the stronger half of silver's long-term historical range.
The author notes the practical stakes: as gold bottomed in recent months, his newsletters aggressively added new trades in smaller miners, and by late August unrealized gains were running as high as +63% in less than six weeks. Of those 18 new trades, mostly gold miners, one was a major silver miner. That company does not report all-in sustaining costs, but its peers' Q2 AISCs ran between roughly $6 to $37 per ounce. With silver averaging over $73 on close last quarter, it was wildly profitable to mine despite the post-parabola bust. Major and primary silver miners are earning substantial profits while their stocks still trade at low valuations relative to underlying earnings.
Rather than guessing price targets, the author offers a conservative scenario: silver is overwhelmingly driven by gold, tending to leverage its major moves by 2x+. If gold's young upleg grows into a new bull rising at a modest 15% annually, that implies 30%+ yearly gains for silver, with miners' profits amplifying further. Assuming major-silver-miner AISCs average $25 this year and climb 10% annually, and a next silver bull run starting at July's average near $58, silver miners' earnings would more than double within two years — and two years of 30% gains would carry silver only near $98 per ounce, still well under January 2026's parabolic extreme above $116. Readers evaluating this framing can watch a few concrete markers the author himself relies on: whether gold's upleg extends, where the SGR settles relative to its recent 65.4x average, and whether miner earnings reports continue to reflect the wide gap between AISCs and realized silver prices.
Traders saddled with recency bias risk missing those gains, the author argues: they will remain apathetic or bearish as long as the herd does, unable to buy relatively low while silver stocks are out of favor, and will only turn bullish after most of the big gains have been won. The remedy is maintaining sufficient perspective on price action.
The bottom line: silver has shown major unsung strength in recent months. Yes, it was cut in half after its parabolic moonshot, but after nearly-half-century extremes those losses could have snowballed beyond three-quarters based on historical precedent. The post-parabola reckoning hammered silver back to its most-oversold levels in almost four years. Since then, silver has staged a decisive breakout from its massive falling-wedge pattern and has remained resilient relative to gold, trading at its best relative levels in over a dozen years. All the recent silver apathy and bearishness has been myopic, the author concludes — silver is faring far better than the herd gives it credit for.
Adam Hamilton, CPA, September 4, 2026. Copyright 2000–2026 Zeal LLC. Zeal LLC specializes in stock-market speculation and investment from a contrarian perspective, studying world markets for buying-low opportunities in undervalued and out-of-favor sectors, with research published in financial-market newsletters serving customers from all states and more than 60 countries.
Source: SilverSeek
