Precious Metals Sector Signals Potential Major Uptrend Breakout, According to Clive Maund's Technical Analysis
Key Takeaways
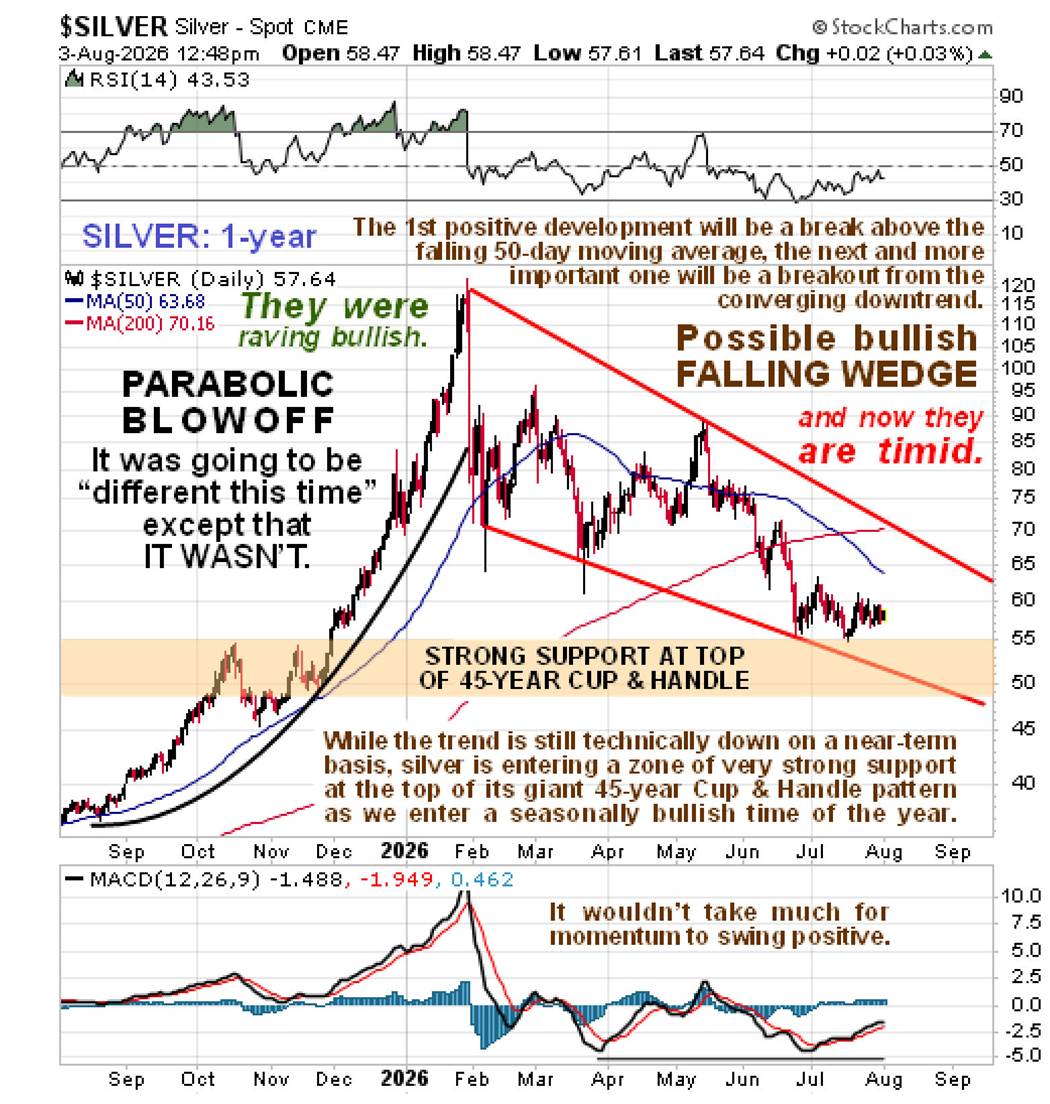
- •Silver's 1-year chart displays a bullish Falling Wedge pattern with tightly compressed Bollinger Bands and an improving Stochastic indicator, conditions historically associated with impending upside breakouts.
- •Silver broke out decisively from a 45-year Cup & Handle pattern last autumn, and the subsequent pullback to the pattern's upper boundary represents a normal post-breakout reaction.
- •The expected second advance could be significantly larger than last year's move, as it would carry silver's price well beyond the long-term formation.
- •The Gold Miners Bullish % index stands at just 21.6%, suggesting considerable room for the mining sector to rally from current levels.
- •Continued expansion of money supply by policymakers, aimed at preventing broader market downturns, is cited as a fundamental driver supporting higher precious metals prices.
Precious Metals Sector Signals Potential Major Uptrend Breakout, According to Clive Maund's Technical Analysis
By Clive Maund
Multiple converging factors suggest that the precious metals sector may be approaching a major new uptrend breakout, according to technical analyst Clive Maund.
One element that had previously introduced caution was the potential threat of a broader market crash or severe downturn. However, Maund notes that policymakers appear inclined to continue staving off such a scenario through large-scale money creation. He cites as an example a proposal to provide Iran with US$300 million for reconstruction purposes, conditional on certain compliance — an initiative he characterizes as indicative of the willingness to generate money out of thin air. This dynamic feeds into a broader macroeconomic backdrop in which sustained expansion of money supply has historically been cited by precious metals advocates as a fundamental driver for gold and silver, which are widely viewed as stores of value relative to fiat currencies.
Maund examines a range of silver charts to outline why a breakout into a major new uptrend is, in his assessment, a growing probability.
Silver's 1-Year Chart: Bullish Falling Wedge Formation
On the 1-year chart, the correction following the preceding parabolic blowoff appears to have run its course. The price action has converged into what Maund identifies as a bullish Falling Wedge pattern — a technical formation generally associated with diminishing downside momentum and a potential reversal higher. Silver has returned to strong support at the upper boundary of a large 45-year Cup & Handle holding pattern, which is examined further in the long-term chart below.
Silver currently sits below a still-rising 200-day moving average, a widely followed trend indicator, while momentum (MACD) is improving. Combined with the entry into a seasonally favorable period for precious metals, Maund suggests conditions are aligned for prices to move higher.
Bollinger Bands and Stochastics Signal Potential Upside
Examining the same 1-year chart with Bollinger Bands and Stochastics overlaid, Maund highlights that the Bollinger Bands have contracted tightly. Bollinger Band compression is often watched by traders as a precursor to expanded volatility. The last comparable compression on this chart occurred one year ago, preceding a significant price movement. Additionally, the Stochastic indicator is trending higher, which Maund interprets as increasing the probability of an upside breakout.
5-Year Chart: Strong Support Zone
The 5-year chart shows the price has reacted back into a zone of very strong support, underpinned by the lower parabolic uptrend trendline. Given the strength of silver's breakout last autumn, Maund notes that it would be unexpected for the price to significantly penetrate this support before resuming its upward trajectory.
The 45-Year Cup & Handle Pattern
Maund describes the long-term silver chart — dating back to 1980 — as presenting an exceptionally bullish technical case. Last autumn, silver broke out powerfully from a 45-year Cup & Handle holding pattern, a multi-decade formation that technical analysts consider one of the most significant long-term bullish structures. The subsequent price action represents a normal post-breakout reaction back to strong support at the upper boundary of the pattern.
This pullback, Maund argues, should give rise to a substantial second upleg. Since this next advance would carry the price well clear of the pattern, he suggests it could be significantly larger than last year's move. He further notes that it would be almost unprecedented for the price to slump back into the pattern following the decisive breakout witnessed last year.
Gold and GDX Comparisons
For completeness, Maund also references a gold chart covering the same period back to 1980 (prepared on August 4 and added on August 5), as well as a 20-month chart for GDX (the VanEck Gold Miners ETF), also prepared on August 4 and added on August 5. GDX is one of the most widely traded vehicles for exposure to gold mining equities, making its chart configuration a commonly referenced sector benchmark. He describes both charts as presenting favorable configurations.
Gold Miners Bullish % Index
The Gold Miners Bullish % index currently shows a low reading of 21.6% bullish. This index tracks the percentage of gold mining stocks currently on point-and-figure buy signals, serving as a breadth measure for the sector. Maund interprets the low reading as indicating substantial room for the sector to advance from current levels.
Looking Ahead
Based on these technical observations, Maund states his intention to continue reviewing selected gold and silver stocks. He encourages readers to review previously published analyses on his site, noting that many of the companies previously covered remain relevant.
This article was posted at 9:30 am EDT on August 4, 2026, on Clive Maund's website. The original article is available at SilverSeek.
About the Author
Clive Maund has been covering the gold and silver markets through his website clivemaund.com. The years following 2005 marked the boom phase of the gold and silver bull market, which peaked in 2011. While debate continues as to whether that represented the final high, Maund's view is that the ongoing global debasement of fiat currencies suggests otherwise. He draws a parallel between the bear market since 2011 and the mid-1970s two-year correction, which was preceded by a powerful advance and followed by a large parabolic rally.

