SHIB Price Fails to Track Shibarium’s 78.51% Daily Transaction Rebound
Key Takeaways
- •Shibarium processed 1,180 daily transactions in the latest recorded session, a 78.51% increase from 661 transactions on July 21.
- •SHIB fell from an intraday high of $0.000004243 to $0.000004102 during a broader cryptocurrency selloff before recovering part of the decline.
- •Shiba Inu has mostly traded between $0.00000415 and $0.00000441 over the past month, showing a narrow and indecisive range.
- •Technical indicators showed neutral to mildly bearish momentum, with SHIB below its 30-day and 200-day moving averages.
- •The article identified $0.00000407 to $0.00000456 as the key range that could determine SHIB’s next directional move.
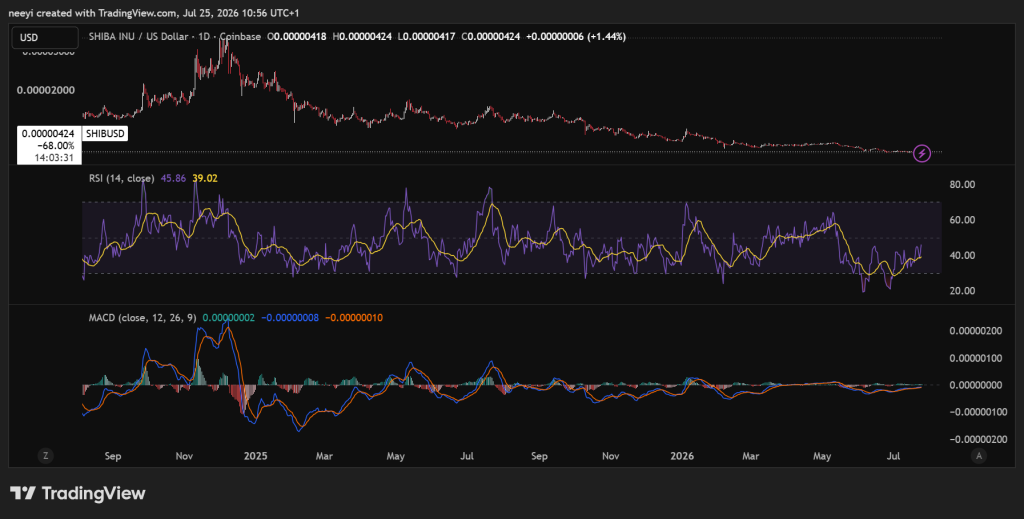
Shibarium posted a sharp recovery in daily transactions, but Shiba Inu’s SHIB token did not move in the same direction, highlighting a disconnect between network activity and the token’s market performance.
Network usage can support a cryptocurrency’s value over time, but transaction growth alone does not always translate into immediate demand for the related token. SHIB continues to face broader market pressure, weak technical conditions, and nearby resistance levels that may limit any short-term recovery.
TheCryptoBasic reported that Shibarium, Shiba Inu’s official Layer-2 blockchain, processed 1,180 daily transactions in the latest recorded session. That was a 78.51% increase from the 661 transactions completed on July 21, which was Shibarium’s second-lowest daily transaction count in July.
The rebound marked a clear recovery from one of the network’s weakest sessions of the month. However, SHIB did not benefit from the higher activity. During a broader cryptocurrency selloff, Shiba Inu’s price fell from an intraday high of $0.000004243 to a low of $0.000004102.
Activity on Shibarium, #ShibaInu ’s official Layer-2 blockchain, surged sharply over the past day, but $SHIB’s price has yet to respond. According to the latest data from Shibariumscan, Shibarium processed 1,180 daily transactions yesterday. This marks a notable recovery from 661… — TheCryptoBasic (@thecryptobasic) July 24, 2026
https://x.com/thecryptobasic/status/2080660813053083742?ref_src=twsrc%5Etfw
SHIB later recovered part of the decline and traded near $0.000004189. Even after that partial rebound, the token remained down 1.28% over 24 hours, 8.21% over seven days, and 0.34% for July.
The gap between stronger Shibarium activity and weaker SHIB pricing appears tied to both scale and market conditions. A gain of 519 transactions is large in percentage terms, but 1,180 daily transactions may still be too small to create meaningful token demand. At the same time, the broader market selloff weighed on major cryptocurrencies and left Shiba Inu exposed despite improved Shibarium figures.
Shibarium, which launched on the Ethereum mainnet in August 2023, was designed to reduce transaction costs for the Shiba Inu ecosystem and expand use cases for SHIB and related tokens including BONE and LEASH. The network is built on Polygon’s edge framework and is intended to serve as the primary scaling solution for Shiba Inu’s decentralized applications and payment initiatives. The platform has attracted periodic waves of adoption, but daily transaction volumes have fluctuated significantly since its early post-launch period, when it processed millions of transactions within weeks of going live.
SHIB Remains in a Narrow Trading Range
Separate market data placed SHIB near $0.00000422. Small differences between data providers can occur, but the broader trading picture remained largely consistent across the two readings.
Over the past month, Shiba Inu has mostly traded between $0.00000415 and $0.00000441. That narrow band indicates that neither buyers nor sellers have established firm control.
Recent performance data was mixed. During the measured period, SHIB gained about 1.13% over 24 hours and 1.67% over seven days. However, the token remained down about 4.5% over 30 days and 68.38% over one year.
SHIB also traded approximately 95.23% below its record high. Its market capitalization stood near $2.49 billion, while daily trading volume was close to $50.78 million.
Those figures show that Shiba Inu continues to have meaningful market liquidity. However, current volume does not indicate the level of demand typically associated with a major SHIB price breakout.
SHIB ranks among the largest meme coins by market capitalization, alongside Dogecoin (DOGE), Pepe (PEPE), and Bonk (BONK). The meme coin sector as a whole has historically been driven by social sentiment, community engagement, and speculative trading rather than network fundamentals, which helps explain why Shibarium’s usage improvements may not produce immediate price effects for the token.
Technical Indicators Point to Weak Momentum
SHIB’s chart shows neutral to slightly bearish momentum. Several indicators have improved, but none provides strong confirmation that a lasting recovery has begun.
The seven-day Relative Strength Index stood at 44.92. The 14-day RSI was 41.64, while the 21-day reading was 39.64. RSI values between 40 and 50 typically indicate neutral or mildly bearish conditions. SHIB remained above the oversold level of 30 but well below the overbought level of 70.
The higher seven-day RSI suggests recent performance has improved compared with the broader 21-day period. Still, the improvement remains too limited to confirm a decisive trend reversal.
Moving averages offered a similar signal. The seven-day simple moving average was near $0.0000041943, while the 30-day average was around $0.0000042548. The 200-day average remained much higher at $0.0000058789.
SHIB traded slightly above its seven-day average but below its 30-day average. More importantly, the large gap below the 200-day average showed that the broader bearish trend remained intact.
The MACD line stood at negative $0.000000088442, compared with a signal line of negative $0.00000010812. The histogram was positive at $0.000000019679. That combination indicates that bearish pressure has eased somewhat, although the very small values mean the recovery signal remains weak and could change quickly.
SHIB also traded just above the daily pivot near $0.000004159. That position gives buyers a slight near-term advantage, but the narrow distance offers limited protection if the broader market weakens again.
SHIB Range Centers on $0.00000407 to $0.00000456
The current indicator mix leaves three main SHIB price scenarios. Each depends heavily on wider cryptocurrency conditions and on whether Shibarium activity develops into stronger token demand.
Base Scenario: SHIB Stays Inside Its Current Range
Relatively stable market conditions could keep SHIB between support near $0.00000407 to $0.00000417 and resistance around $0.00000444 to $0.00000456.
The lower area includes the recent swing low and important Fibonacci levels. The upper area includes nearby Fibonacci resistance and the recent swing high.
Under this scenario, RSI readings would likely remain between 40 and 50. MACD could stay close to zero as buyers and sellers continue to contest the same narrow price area.
The recent increase in Shibarium transactions may support attention around the ecosystem. However, activity would need to remain elevated before it could provide stronger backing for Shiba Inu’s price.
Bullish Scenario: SHIB Challenges $0.00000487
Improved meme coin demand or stronger Shibarium developments could help SHIB challenge the recent high near $0.00000456. A confirmed move above that level would open possible targets between $0.00000470 and $0.00000487.
For that outcome, SHIB would need to remain above the daily pivot and its seven-day moving average. RSI readings would likely need to rise toward the 55 to 65 range, while the MACD histogram would need to become more positive.
A transaction increase sustained across several sessions would make the network recovery more convincing. A single strong daily reading does not confirm that Shibarium usage has entered a lasting expansion phase.
Bearish Scenario: SHIB Breaks Below $0.00000407
Renewed weakness across the cryptocurrency market could push SHIB below recent support near $0.00000407. A sustained break under that level would end the current range and expose Shiba Inu to new local lows.
In that outcome, RSI readings could fall toward 35 or lower. MACD would likely return to a clearer negative position as selling pressure increased.
A quick recovery above the daily pivot would weaken that bearish scenario. SHIB would then need to reenter the area between $0.00000417 and $0.00000444 to restore its previous range.
Shibarium’s 78.51% transaction increase was notable compared with the weak July 21 figure. However, SHIB’s price remains shaped by broader market pressure and a difficult technical structure.
Network activity would need to stay stronger for a longer period before it could support a clearer change in demand. SHIB would also need to reclaim nearby resistance and move closer to its 30-day average before the chart presents a stronger recovery case.
Shiba Inu now faces a key test between $0.00000407 and $0.00000456. A move outside that range could show whether Shibarium’s transaction rebound has staying power or remains a short-lived improvement during a difficult month.
Additional Context
The source also stated that Shiba Inu is highly unlikely to reach $1 because such a move would require a mathematically unrealistic market capitalization of roughly $589 trillion, exceeding the total value of all global assets combined.
It also noted that Shiba Inu’s position over the next five years will depend on ecosystem growth, market volatility, and token utility, with forecasts ranging from modest gains to significant declines.

