Shiba Inu Breaks Descending Trendline, but Buyers Face Key Resistance Tests
Key Takeaways
- •SHIB broke above a descending trendline on July 23 but still trades below its 50-day, 100-day, and 200-day simple moving averages, leaving the broader downtrend intact.
- •The July 15 high near $0.00000435 serves as the first critical resistance, while $0.00000458 marks the level that would determine whether a bullish reversal interpretation is valid.
- •SHIB has tested the $0.00000405 support region twice without setting a lower low, producing a pattern that could be read as either a double bottom or a descending triangle.
- •The RSI has formed a bullish divergence near 42.5, but trading volume has contracted for approximately three weeks and did not expand during the trendline breakout.
- •Shibarium has surpassed 1.5 billion cumulative transactions since its August 2023 launch and is working to integrate Fully Homomorphic Encryption technology using Zama's solution, though no activation date has been announced.
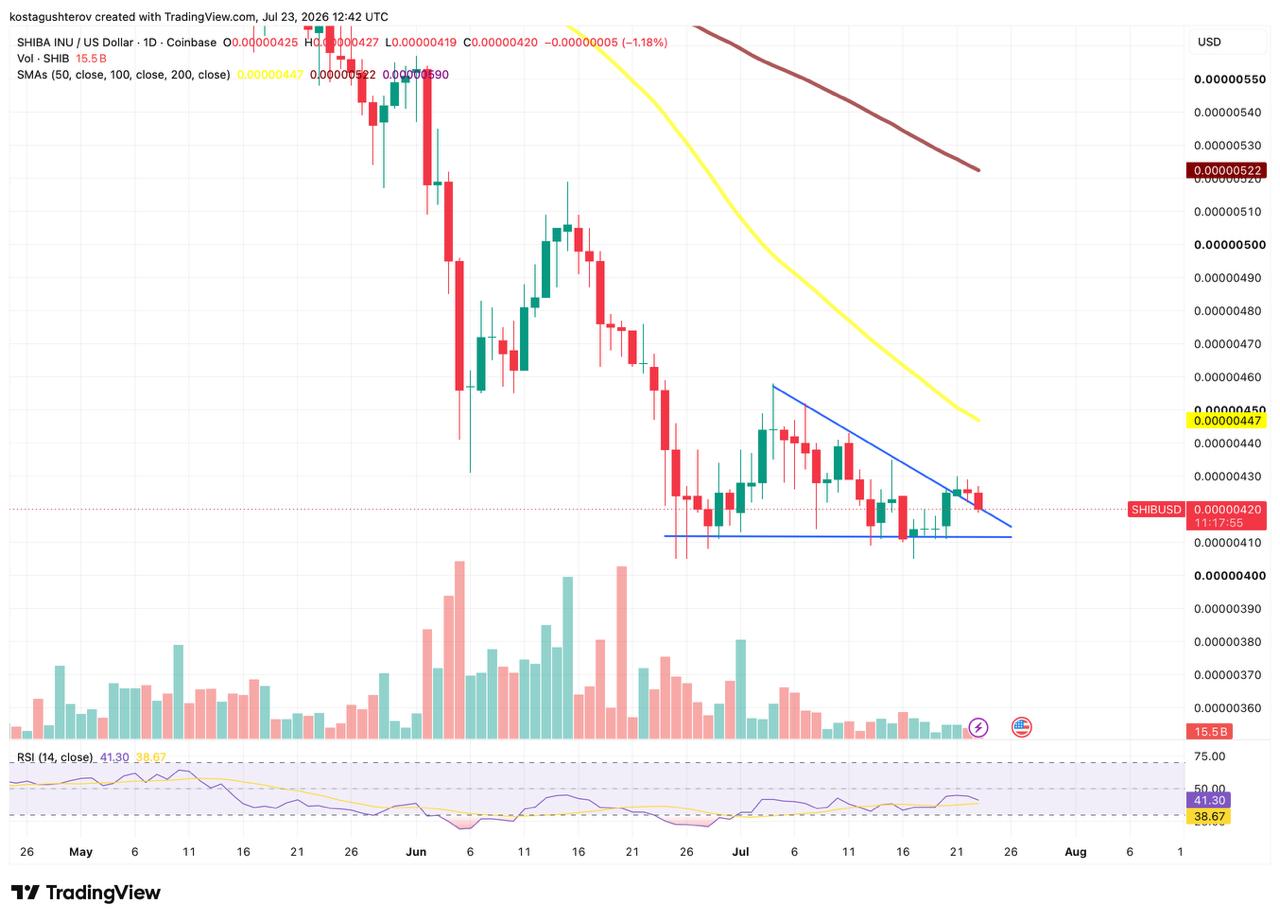
Shiba Inu (SHIB) traded near $0.0000042 on July 23, according to TradingView data sourced from Coinbase, after breaking above a descending trendline that had capped the token since its July 4 local peak. The move places SHIB close to its lowest daily chart level since September 2021 and slightly above the former resistance line near $0.00000418, but does not yet confirm a broader trend reversal. SHIB ranks among the largest meme tokens by market capitalization, meaning its chart developments often draw attention from traders watching broader sentiment in the speculative altcoin segment.
The breakout interrupts a sequence of lower highs and marks an early improvement in SHIB's short-term structure. However, price remains below the 50-day, 100-day, and 200-day simple moving averages, and trading volume has contracted for approximately three weeks.
Breakout Requires Follow-Through
The descending trendline connected a series of lower highs dating back to the July 4 local peak. Breaking above it halts that pattern, but the key question is whether the former resistance near $0.00000418 can transition into support following a successful retest.
As long as SHIB holds above approximately $0.00000418, the breakout could remain intact and allow another attempt at the July 15 high near $0.00000435. A daily close back below the trendline, however, would weaken that interpretation and could send price toward the $0.00000411 shelf, where buyers recently attempted to stabilize.
$0.00000435 as the First Critical Resistance
The July 15 high near $0.00000435 carries more significance than the trendline itself, as it represents the most recent visible swing high. A move above that level could signal that SHIB is beginning to replace its pattern of lower highs with a more constructive short-term structure.
Such a move would also bring the falling 50-day simple moving average, currently near $0.00000447, into focus. The next major resistance sits around $0.00000458, the level where the July 4 recovery stalled — and the point that ultimately determines how the current structure should be interpreted.
Dual Interpretations of the $0.00000405 Floor
SHIB has tested the $0.00000405 region twice without establishing a lower low. These equal lows form the horizontal floor of the current structure and lend themselves to two opposing readings.
Interpreted as a double bottom, the equal lows represent a potential reversal pattern that would confirm on a break above the peak separating them, near $0.00000458. Read as a descending triangle, the same flat floor beneath a series of lower highs more typically resolves downward.
Both descriptions fit the current chart, which is why neither should be treated as a forecast. The distinguishing level remains the same: a daily close above $0.00000458 would favor the bullish reading, while a decisive break of $0.00000405 would confirm the bearish one. Until either occurs, the structure is more accurately described as a basing attempt than a named pattern.
The repeated defense of $0.00000405 does suggest selling pressure weakened near the chart low, though it does not guarantee the floor will continue to hold.
Momentum Improves While Volume Lags
The relative strength index (RSI) sits near 42.5 and has begun turning higher after forming a bullish divergence — while price returned to the same support area, RSI produced a stronger low. This could indicate that bearish momentum was weakening during the second test of $0.00000405. The indicator also remains well below overbought territory, leaving room for further momentum improvement if buying pressure increases.
Volume, however, provides a less convincing signal. Trading activity has gradually declined throughout the formation of the current structure, and the trendline break was not accompanied by any expansion in participation. While contracting volume is common during price compression, stronger activity would lend greater credibility to a move through $0.00000435. Without it, SHIB risks continuing to drift around the breakout area without establishing a durable advance.
Downside Risk Levels
A daily close below $0.00000418 would place SHIB back beneath the broken trendline and raise the risk that the breakout was temporary. The first downside reference would sit around $0.00000411; holding that shelf could still allow another recovery attempt, though the technical setup would be weaker.
The more critical level remains $0.00000405. A confirmed break below it would invalidate the equal lows, break the horizontal floor of the structure, and resolve it in the direction of the broader downtrend, establishing a new yearly low.
Shibarium Development Continues
Price action is unfolding alongside ongoing development of Shibarium, the Shiba Inu ecosystem's Ethereum layer-2 network, which launched in August 2023. The official Shibarium explorer records more than 1.5 billion cumulative transactions. That figure measures total network activity but does not by itself indicate how much demand will reach SHIB or whether activity is currently growing. The network's base transaction fees are allocated toward burning SHIB tokens, though the mechanism's measurable supply impact depends on sustained transaction volume.
The ecosystem is also working to incorporate Fully Homomorphic Encryption (FHE) into Shibarium. FHE enables calculations to be performed on encrypted data without first revealing the underlying information. The official Shib.io roadmap includes an FHE-powered version of Shibarium, while the developer page states the integration is expected to use technology provided by Zama. No specific activation date is listed.
Broader Trend Still Unresolved
The trendline break has improved SHIB's immediate setup, but the broader chart remains bearish. Price continues to trade below all three major moving averages, reflecting wider weakness that has left most Binance-listed altcoins below their 200-day averages for the longest stretch since 2022. Meme tokens have been particularly sensitive to shifts in speculative risk appetite, and SHIB's inability to reclaim its major moving averages mirrors that wider segment pressure.
For now, SHIB has produced an early countertrend break rather than a confirmed reversal. The next phase will likely depend on whether price can hold above the former trendline, attract stronger volume, and move beyond recent swing highs.
Source review: Based on SHIB/USD daily chart data from TradingView (Coinbase), the official Shibarium block explorer, and Shib.io project documentation, checked July 23, 2026.