Robinhood Chain Tops Major Networks in DefiLlama Revenue Ranking – What Drove the Number?
Key Takeaways
- •Robinhood Chain ranked first in DefiLlama's live 24-hour chain revenue table with $4.01 million, ahead of Canton's $1.69 million and Tron's roughly $874,000.
- •The ranking measures network revenue from gas fees after Ethereum costs, not Robinhood Markets' corporate income.
- •Users paid $4.45 million in gross transaction fees, while applications on the chain retained $4.32 million, measured separately from chain revenue.
- •The Arbitrum Expansion Program receives 10% of Robinhood Chain's net revenue, with 80% going to the Arbitrum DAO treasury and 20% to a developer fund.
- •The available data cannot show that tokenized equities drove the revenue surge, as the dashboard does not isolate stock-token activity.
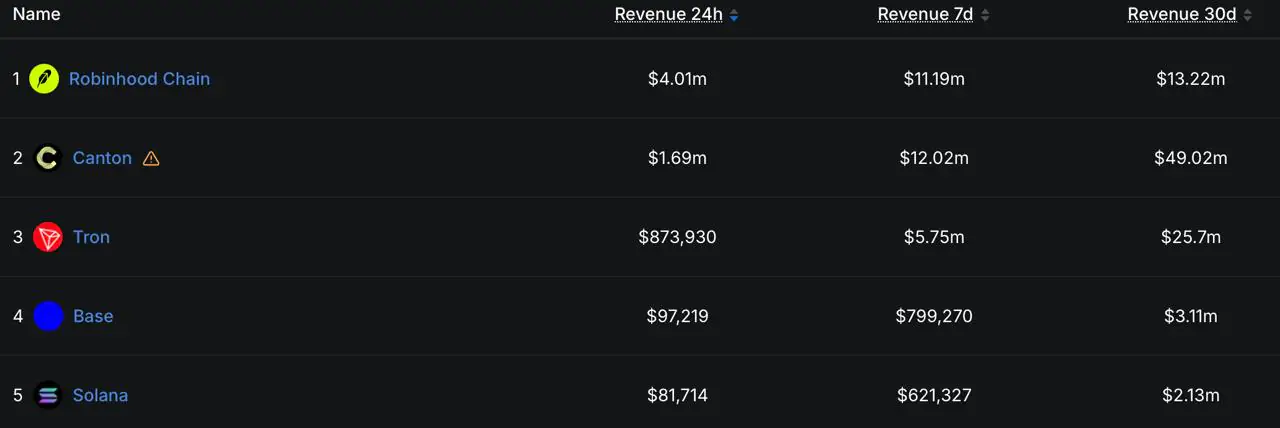
Robinhood Chain claimed the top spot in DefiLlama's live revenue ranking, but the figure measures network revenue from gas fees – not Robinhood Markets' corporate earnings. Here is what the data actually shows.
A Revenue Lead, Not a Robinhood Earnings Report
All DefiLlama figures cited here are live rolling 24-hour readings and may change after publication.
At the time of writing, DefiLlama's revenue ranking placed Robinhood Chain first with $4.01 million in 24-hour chain revenue, ahead of Canton at $1.69 million and Tron at roughly $874,000.
The result requires context. DefiLlama's chain-revenue metric is not Robinhood Markets' corporate income. It measures the revenue retained by the network after Ethereum execution and data costs, as well as the share allocated through the Arbitrum Expansion Program.
Robinhood's public mainnet is an Ethereum-compatible Layer 2 built with Arbitrum technology. It was designed to support tokenized assets and open DeFi activity, but the revenue dashboard measures what users paid to use the network – not which Robinhood product generated each transaction. This fee-based model is how Layer 2 networks generally monetize: like Ethereum and other Arbitrum-based chains, the operator collects transaction fees and nets them against the cost of settling on the underlying network. A ranking like this therefore reflects how intensively a chain is being used, not how profitable its corporate parent is.
Most of the Chain's Revenue Came from Gas
Users pay ETH to send transactions and interact with applications on Robinhood Chain. Those payments cover Layer 2 execution and the cost of posting data back to Ethereum. During the same 24-hour period, the network recorded $4.45 million in gross transaction fees – ETH paid for Robinhood Chain gas.
That gap explains why fees and revenue should not be treated as interchangeable. Fees show what users spent; revenue estimates what the chain retained after its specified costs.
- $4.45M – Chain fees: the gross amount users paid in ETH to transact on the network.
- $4.01M – Chain revenue: the net amount DefiLlama attributes to the chain after listed costs and revenue sharing.
- $4.32M – App revenue: revenue retained by applications on the chain, measured separately from network revenue.
The Arbitrum Expansion Program receives 10% of Robinhood Chain's net revenue, with 80% directed to the Arbitrum DAO treasury and 20% to a developer fund, according to DefiLlama's methodology.
Trading and Launches Are Generating the Largest Fees
The application-level breakdown shows where users spent the most. DefiLlama's fee dashboard listed Uniswap as the largest source of user-paid application fees, at about $8.92 million. That is a swap-fee total paid by traders – not $8.92 million of revenue retained by Uniswap.
Pons and GMGN also stand out. Pons collects launch and swap fees, while GMGN charges users who trade through its bot. Together, the data points to crypto-native activity – swaps, token launches, and automated trading – as a major source of the day's onchain spending.
These application figures belong to their respective protocols and should not be added to Robinhood Chain's $4.01 million of net chain revenue, because they measure a different layer of the ecosystem.
The Dashboard Does Not Isolate Stock Token Demand
Robinhood built the network to support tokenized stocks, exchange-traded funds, and other real-world assets. When checked, its live dashboard showed roughly $196 million in active RWA market capitalization, $1.40 billion in DEX volume, and $304.6 million in perpetual-futures volume.
Those readings show substantial activity, but they do not reveal how much of the day's gas or application fees came from Stock Tokens. The available data therefore cannot support a claim that tokenized equities caused the revenue surge. What it does show is that trading infrastructure is currently producing large amounts of fee-paying usage around the chain.
Why the Arbitrum Connection Matters
Robinhood Chain's revenue is relevant beyond its own network because a portion flows back into Arbitrum's ecosystem. That relationship is part of the chain's design, which Coindoo examined in its analysis of Robinhood Chain's growth within the Arbitrum ecosystem.
The contrast with Arbitrum Nova's move into reduced support is clear. Robinhood Chain is generating fee-paying activity, while Nova's user and DeFi activity declined before its support model was reduced.
What Would Show the Surge Is Lasting
A single 24-hour lead does not establish a durable business. The next signal will be whether chain revenue remains high after launch and trading activity cools, while DEX volume, stablecoin balances, and RWA activity continue to rise together.
Readers can follow the live revenue ranking, the fee breakdown, and Robinhood Chain metrics. A sustained mix of network fees and real-world-asset activity would be stronger evidence than one day of activity dominated by crypto-native trading.
This article first appeared on Coindoo.

