Quant Price Prediction 2026–2032: QNT Targets $430 in 2026 and $2,291.68 by 2032
Key Takeaways
- •Quant is trading near $235 after falling more than 10% in 24 hours, with trading volume declining to $83 million as sellers pushed the token below immediate Fibonacci levels.
- •Cryptopolitan's forecast projects QNT could reach a maximum of $430 in 2026 and climb as high as $2291.68 by 2032, based on the project's utility, tokenomics, and market trends.
- •Technical analysis places immediate resistance at $272.06 and support at $223.47, with a break above resistance potentially lifting QNT toward $318.97 and a drop below support opening a correction toward $183.26.
- •TCH selected Quant to power interoperability for its On-Chain Money Initiative, with the network expected to launch in the first half of 2027.
- •Over the past seven days, QNT rallied from around $64 to a high of $371 before retracing to roughly $260, according to a Cryptopolitan report on September 28.
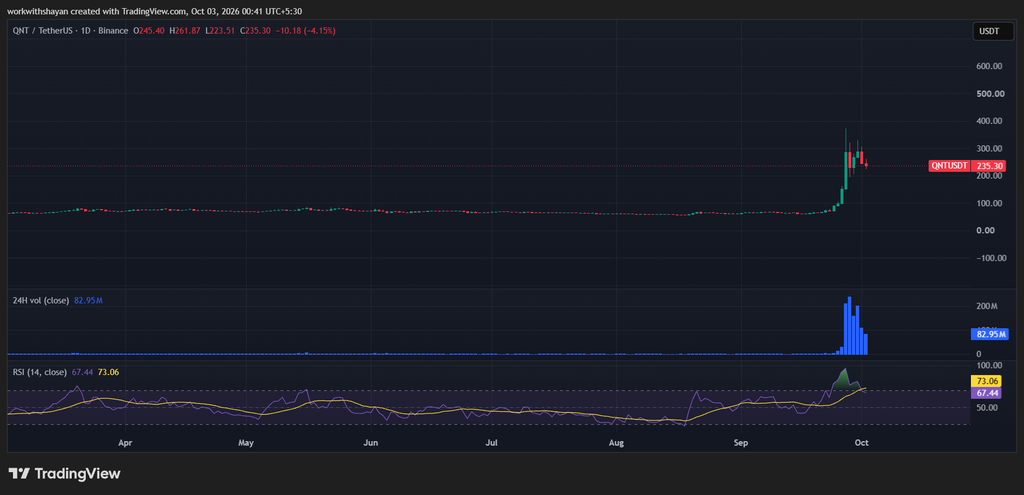
Quant (QNT) is navigating heightened volatility around the $250 mark, and a fresh Cryptopolitan analysis projects that the token could climb to a maximum of $430 in 2026 before reaching an estimated $2,291.68 by 2032. The forecast arrives as QNT trades under short-term bearish pressure, having slipped by more than 10% over the past 24 hours.
According to the report, altcoins have gained following Donald Trump's return to the White House and his crypto-friendly posture. Should the broader crypto market undergo a bullish reversal, demand for Quant could surge, potentially pushing its price beyond $100. The analysis adds that, at resistance levels of $100 and $90, bullish investors might find attractive opportunities.
The prediction examines the project's utility, tokenomics, and market trends, offering a price outlook for QNT from 2026 through 2032. Launched in August 2018, Quant positions itself as an interoperability layer designed to connect blockchains with enterprise networks.
QNT Price Analysis: Bearish Pressure Toward $235
The QNT price analysis for 2 October confirms that Quant faced bearish pressure amid increased selling activity, with the price hovering near $235 and attempting to hold above $230. Key levels cited in the analysis place resistance at $272.06 and support for QNT/USD at $223.47.
Daily Chart: QNT Attempts to Meet Sellers' Demand
On the daily chart, Quant's price staged a bearish correction after sellers pushed the token below immediate Fibonacci lines. Over the last 24 hours, QNT has traveled a solidly bearish path while holding above $90, according to the report. Trading volume declined to $83 million over the period, signaling reduced interest in trading activity.
Quant is currently trading at $235, down more than 10% in the last 24 hours. Meanwhile, the RSI-14 trend line has climbed from its previous level and hovers around the 67 mark, indicating that bulls are slowly regaining momentum. The SMA-14 level suggests upward volatility over the next few hours.
4-Hour Chart: Activity Around EMA Trendlines
The 4-hour chart shows QNT continuing to experience bullish activity near the exponential moving average (EMA) lines, creating a positive sentiment on the price chart. As the price holds above the EMAs, bulls are targeting a break above the EMA20 trend line.
However, the Balance of Power (BoP) indicator is trading in bearish territory at 0.76, hinting that sellers are building pressure near resistance levels and pushing for a downward correction. In addition, the MACD trend line has printed red candles below the signal line, with the indicator pointing toward negative momentum and strengthening the bearish position.
What to Expect From QNT Price Analysis Next
The hourly chart confirms that bears are working to prevent an immediate surge in the Quant price. Even so, the analysis outlines two scenarios. If QNT breaks above $272.06, it may extend higher and touch the resistance at $318.97. Conversely, if bulls cannot initiate a rally, the price may slip below the immediate support at $223.47, opening the door to a correction toward $183.26.
Is QNT a Good Investment?
The report suggests the question is not straightforward to assess. QNT demonstrated remarkable resilience in 2022—widely remembered as a difficult year for the sector—quietly becoming one of crypto's success stories as it consistently outperformed the market. At the same time, the analysis cautions that Quant remains vulnerable to market crashes. In its view, with the QNT price set to climb further, the token could be a good investment option over the long run. As with any cryptocurrency, thorough research is crucial before investing in QNT.
Why Is the QNT Price Down Today?
QNT came under bearish pressure after buyers failed to hold the price above $250.
Will the QNT Price Recover?
Per the analysis, if buyers push the price back above $250, a strong recovery toward $300 could follow.
Will QNT Price Reach $100?
QNT already touched the $100 mark in 2026, and the price is now aiming to surge further.
Will QNT Price Reach $1,000?
The report states that, with community effort, Quant's price will continue to increase and could reach $1,000 in the coming years.
Is QNT a Good Long-Term Investment?
QNT has gained popularity on the back of strong community support, but the publication notes that thorough research into the project's long-term potential is needed to determine whether it represents a viable long-term investment.
Recent QNT News
The analysis highlights two recent developments:
- TCH selected Quant to power interoperability for its On-Chain Money Initiative, with the network expected to launch in the first half of 2027.
- Over the past seven days, QNT rallied from around $64 to a high of $371 before retracing to roughly $260, as reported by Cryptopolitan on September 28.
For readers tracking the project beyond the charts, the On-Chain Money Initiative's launch window offers a concrete enterprise milestone to watch alongside the price levels outlined above.
QNT Price Prediction for October 2026
Over the last few days, the QNT price has been trending upward and is attempting to clear crucial Fibonacci levels. The report notes that if Bitcoin (BTC) mounts a recovery above $100K in October, QNT could see a solid recovery of its own.
According to the technical analysis, QNT could record a maximum of $300 and a minimum of $71 in October, with an expected average trading price of $200 throughout the month.
Quant Price Forecast for 2026
In 2026, the lowest predicted price for Quant is $50. The price could surge to a high of $430 while maintaining an average of around $150.
Quant Price Predictions 2027–2032
2027: Quant is anticipated to reach a minimum price of $318.47. The price could climb to a high of $459.83, averaging around $376.92 for the year.
2028: The forecast indicates a minimum of $472.61 for Quant. The price is expected to reach up to $682.14, with an average of $548.37 across the year.
2029: The analysis suggests a minimum price of $651.28. Quant could reach a high of $941.75, with an average price of $783.46.
2030: Based on technical analysis of past data, Quant is expected to reach a minimum of $884.53. The maximum could be $1,318.64, with an average of $1,067.82.
2031: The same methodology points to a minimum of $1,126.79. The maximum could be $1,728.35, with an average of $1,394.58.
2032: Quant could record a minimum of $1,487.36. The price may climb to a maximum of $2,291.68, with the average expected to remain around $1,836.74 for the year.
Cryptopolitan's QNT Price Prediction
Cryptopolitan says it is bullish on Quant's price movements, the coin expected to surge to new highs by the end of this year. The publication reiterates its 2026 outlook: a lowest predicted price of $50, a potential high of $430, and an average of around $150.
Quant Historical Price Sentiment
The publication's historical snapshot shows the scale of QNT's swings through the sector's shifting market conditions:
- September 2026: QNT skyrocketed toward $350.
- September 2025: the price declined toward a low of $85.
- February 2025: Quant dropped below the crucial $100 mark.
- December 2024: the price skyrocketed toward $165.
- October 2024: Quant declined below $60.
- July 1, 2024: $79.2950.
- June 8, 2024: $85.2069.
- April 8, 2024: $120.22.
- One year ago: $102.5174.
- Launch (August 11, 2018): Quant debuted at $0.2524.
As with all forward-looking price forecasts, the figures above reflect the publication's technical analysis and stated expectations rather than guarantees of future performance.

