Q2 GDP Growth Slowed to 1.5% as Inflation, Imports, and Federal Spending Weighed on Output
Key Takeaways
- •Real GDP grew at a 1.5% annualized rate in Q2, well below the pre-pandemic historical average of roughly 2.5%, as inflation, imports, and reduced federal spending weighed on output.
- •The GDP deflator rose at a 6.3% annualized rate, far exceeding the Federal Reserve's 2% target and reinforcing the central bank's decision to maintain its benchmark rate at a two-decade high.
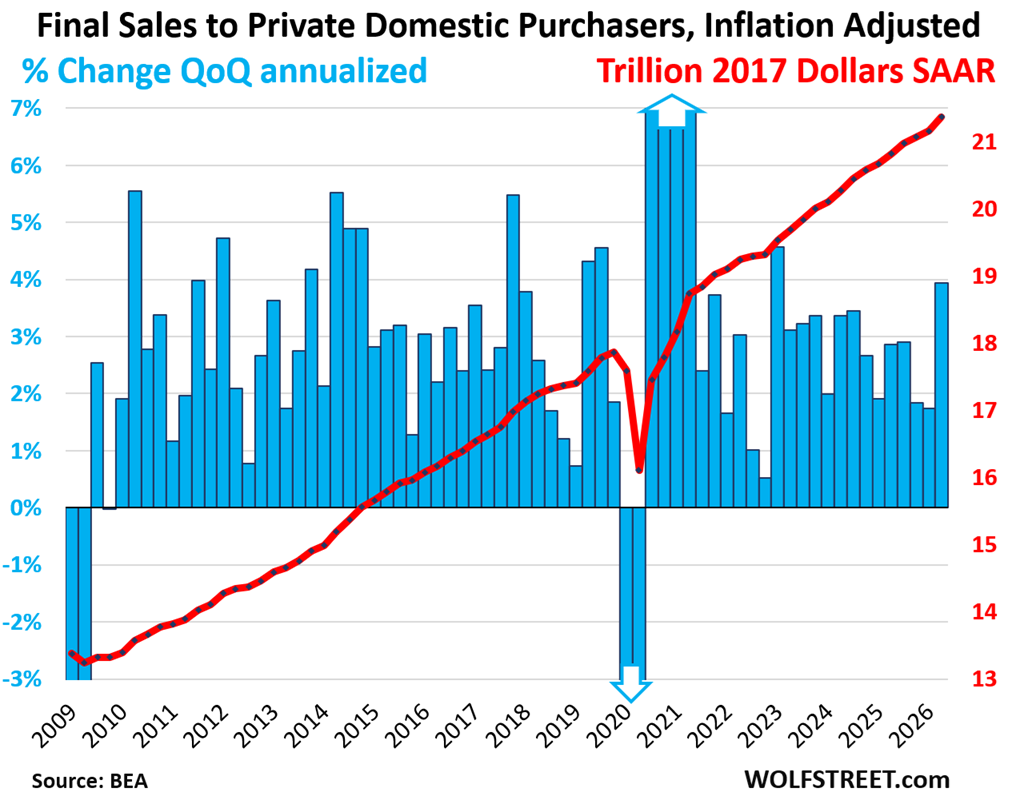
- •Private-sector demand remained robust, with Real Final Sales to Private Domestic Purchasers increasing 3.9%, the strongest pace since Q1 2023, fueled by consumer spending and business investment.
- •Imports surged 11.5% annualized, driven largely by AI-related electronics and semiconductors, subtracting 1.51 percentage points from GDP growth and exceeding the economy's total growth for the quarter.
- •The Treasury debt-to-GDP ratio declined slightly to 121.5% as nominal GDP growth of 7.9% outpaced the 1.0% quarterly increase in government debt.
Soaring imports, a drop in federal government spending, and changes in private inventories weighed on GDP growth in the second quarter.
Two major developments stood out in the Q2 GDP data.
First, inflation was exceptionally strong. The GDP deflator, which measures inflation across the entire economy — including consumers, businesses, and governments — rose at a 6.3% annualized rate in the second quarter. That figure remains well above the Federal Reserve's 2% inflation target and reinforces why the central bank has kept its benchmark policy rate at its highest level in over two decades. Without adjusting for that inflation, current-dollar GDP increased by 7.9%. After adjusting for price changes, real GDP rose by only 1.5%, according to Bureau of Economic Analysis data released today.
Second, domestic private-sector demand remained strong. Real Final Sales to Private Domestic Purchasers increased at a 3.9% annual rate, adjusted for inflation, the strongest pace since Q1 2023. That growth was driven by consumer spending, which rose 3.2%, and private fixed investment, which climbed 7.0%, both in inflation-adjusted terms. The resilience of private demand, even as inflation erodes purchasing power, has been a defining feature of the current expansion.
Real Final Sales to Private Domestic Purchasers equals real GDP excluding government, imports, exports, and changes in inventories. It is a measure of private-sector domestic demand and represents about 88% of total GDP.
Overall real GDP grew only 1.5% in the quarter, held back by the 6.3% inflation rate, a sharp increase in imports — partly tied to high-value AI data-center equipment — a decline in federal government consumption expenditures and gross investment, and changes in private inventories.
For context, average quarter-to-quarter GDP growth between the Great Recession and the pandemic, excluding recessions, was 2.5% at an annual rate. Over the full 20-year period including recessions, the average was 2.2%.
Current-dollar GDP, which is not adjusted for inflation, rose 7.9% to $32.5 trillion at an annual rate. That nominal figure represents the economy's size in today's dollars and serves as the basis for the debt-to-GDP ratio and similar measures. The gap between the 7.9% increase in current-dollar GDP and the 1.5% rise in real GDP reflects the 6.3% GDP inflation measure in the quarter.
Consumer spending increased at a 3.2% annual rate in Q2, adjusted for inflation. Consumer spending accounted for 69% of the US economy and added 2.1 percentage points to overall GDP growth.
Spending growth was broad-based across goods and services, though consumers spent especially strongly on durable goods such as motor vehicles, computers, smartphones, appliances, and bicycles. In inflation-adjusted terms:
- Services: +2.2%
- Durable goods: +6.8%
- Nondurable goods: +4.4%
Private fixed investment, excluding inventory changes, jumped 7.0% annualized in real terms. Within that category:
- Nonresidential fixed investment: +8.4%
- Structures: -5.0%
- Equipment: +15.2%
- Intellectual property products, including software and movies: +8.8%
- Residential fixed investment: +1.5%, the first increase after five consecutive quarterly declines
The surges in equipment investment and intellectual property products align with a broader corporate capital-spending cycle tied to artificial intelligence infrastructure, as major technology companies have publicly committed tens of billions of dollars to data-center buildouts and related hardware. The modest gain in residential fixed investment, meanwhile, came against the backdrop of mortgage rates that remain elevated by historical standards, weighing on homebuilding and sales activity.
Private fixed investment accounted for 18% of the US economy and contributed 1.2 percentage points to the quarter's 1.5% GDP growth.
Government consumption expenditures and gross investment declined 0.8% annualized in real terms, with the entire drop coming from lower federal nondefense spending.
This GDP measure of government spending does not include interest payments or transfer payments made directly to consumers, such as Social Security, which are counted in GDP only when recipients spend or invest those funds.
Federal government spending fell 4.1% annualized in Q2, after a 4.4% surge in Q1, when government spending filled some of the gaps left by last fall's shutdown. Within the federal total:
- National defense: +2.4%
- Nondefense: -12.9%, after a 20.7% surge in Q1
The decline in federal spending subtracted 0.26 percentage points from GDP growth. State and local government spending rose 1.1% and added 0.12 percentage points.
Together, federal, state, and local government consumption and investment accounted for 17% of the US economy. Roughly 60% of that total came from state and local governments, while federal spending accounted for about 40%.
Trade deficit widened as imports surged
Imports rose 11.5% annualized in real terms, driven by a surge in electronic products, including semiconductors linked to the AI data-center boom. Because imports subtract from GDP, that increase reduced Q2 growth by 1.51 percentage points. The scale of that drag — larger than the economy's total growth — highlights how dependent the current investment cycle has become on foreign-produced technology goods.
By category:
- Imports of goods: +14.7%
- Imports of services: +0.1% (including US tourists spending overseas)
Exports increased 4.5% and added 0.50 percentage points to GDP growth.
- Exports of goods: +8.9%
- Exports of services: -3.3% (including foreign tourists spending in the US)
Net exports worsened to an inflation-adjusted trade deficit of $1.08 trillion.
The government's Treasury debt-to-GDP ratio edged down to 121.5%. Current-dollar GDP rose 1.9% quarter-to-quarter, not annualized, to $32.5 trillion, while Treasury debt increased 1.0% quarter-to-quarter to $39.5 trillion. In other words, the economy grew faster than the debt in Q2, allowing the ratio to dip slightly.
That is the logic behind "letting it run hot," in which higher inflation and faster nominal growth reduce the burden of debt. But beyond the quarter-to-quarter movement, the broader trend remains upward.
Enjoy reading WOLF STREET and want to support it? You can donate. I appreciate it immensely. Click on the mug to find out how:

