Polkadot (DOT) Gains 3.88% as Price Tests $1.25 Resistance
Key Takeaways
- •DOT rose 3.88% on Monday to trade near $1.23, finishing near the day's high and within one cent of the $1.25 resistance level.
- •The token now trades above its 7-, 20-, 50-, and 200-day moving averages in a bullish alignment, but the MACD meeting its signal line indicates buying momentum is no longer increasing.
- •Among top traders on Binance futures, 68.1% are long with a 2.13-to-1 long-to-short ratio, while retail traders are 62.7% long.
- •Recent order flow showed sell volume about 21% higher than buy volume in the latest hour, and open interest declined 2.45% over 24 hours as the price rose.
- •Analyst Terrill Dicki assigns a 52% probability to a high-volume breakout above $1.25 that could reach $1.35–$1.38 within 30 days, versus 48% for a break below $1.16 toward the $1.02–$1.06 zone.
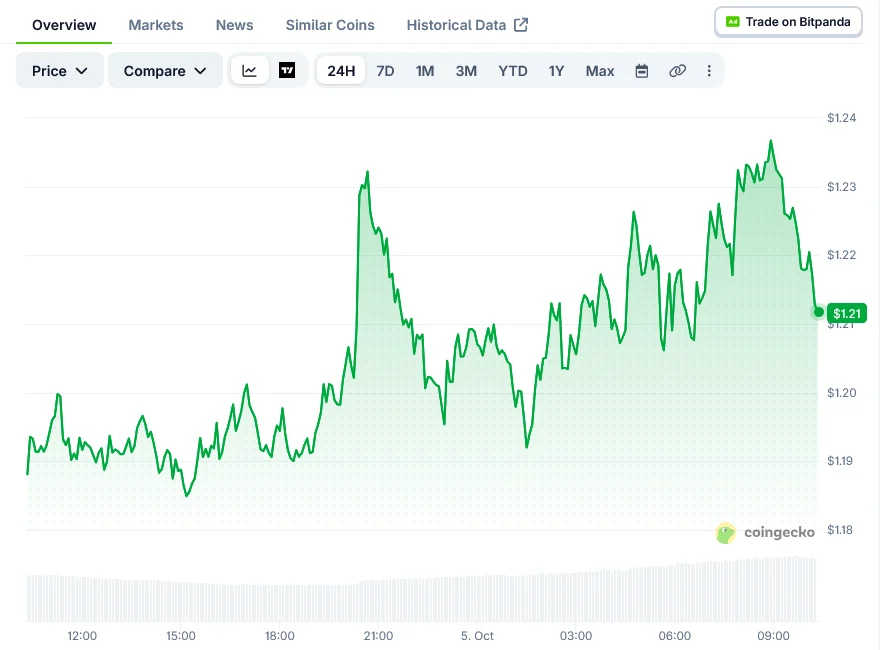
Polkadot’s DOT token rose 3.88% on Monday to trade near $1.23, bringing it close to resistance at $1.25. During the session, DOT moved between $1.18 and $1.24, finishing near the day’s high and within one cent of the resistance level. For readers newer to the asset, DOT is the native token of the Polkadot network, where it is used for on-chain governance, staking, and bonding.
The advance follows several weeks of relatively tight trading. A few weeks ago, DOT’s 50-day and 200-day moving averages were positioned between $1.02 and $1.06. The token is now trading above its 7-, 20-, 50- and 200-day moving averages, with the shorter-term averages also above the longer-term lines. That stacking — price above every major average, with faster lines over slower ones — is what technicians call a bullish alignment, since it means recent trading prices sit above the average of prior months.
Momentum indicators flatten
Technical indicators present a mixed picture. DOT’s Moving Average Convergence Divergence (MACD) line has met its signal line, while the histogram shows no gap between them. This indicates that buying momentum is no longer increasing. The MACD compares two moving averages of price to measure trend strength, making the gap between the two lines a widely watched momentum gauge.
The Relative Strength Index (RSI) is near 60, leaving room before the token reaches levels generally considered overbought. The RSI runs from 0 to 100, with readings above 70 traditionally flagged as overbought and below 30 as oversold. The Stochastic indicator is moving toward its upper range, suggesting that the current short-term cycle may be approaching maturity.
DOT has used approximately 74% of its Bollinger Band range. The lower band is at $1.05, while the upper band is at $1.29. Bollinger Bands plot volatility channels above and below a moving average, and the upper band often acts as a ceiling while price remains inside the channel. A daily close above $1.29 would indicate a move into a new, higher range.
On the downside, $1.22 is the pivot point and $1.20 represents immediate support. A close below $1.20 could send DOT toward the $1.16 to $1.17 area. The Average True Range (ATR) is $0.09, equivalent to a daily price swing of approximately 7%. ATR measures the typical span of recent daily sessions, a yardstick for how much ground price usually covers in one day.
Futures traders remain net long
Derivatives data shows that many traders are positioned for higher prices. Among top traders on Binance futures, 68.1% are long, producing a long-to-short ratio of 2.13 to 1. Retail traders are 62.7% long.
Recent order-flow data provides a different indication. During the latest hour, sell volume was approximately 21% higher than buy volume. Open interest also declined 2.45% over 24 hours, indicating that traders closed positions as the price increased. Open interest tracks the total number of outstanding futures contracts, making its direction a common check on whether a move is supported by fresh positions.
The funding rate was neutral at 0.0100%, showing no heavy buildup of leveraged long positions. Funding rates are the periodic payments exchanged between perpetual futures traders, and readings near zero are generally taken to mean neither side is paying up aggressively for leverage.
Spot trading volume on Binance was approximately $11.5 million during the session. According to the analysis, a move above $1.25 would require two to three times the current daily volume to confirm a breakout — volume confirmation being a standard criterion in technical analysis for distinguishing sustained range breaks from brief spikes.
Blockchain.news analyst Terrill Dick assigns a 52% probability to the bullish scenario. Under that scenario, a high-volume close above $1.25 could open a path toward $1.27 and $1.29, followed by $1.35 to $1.38 over 30 days.
Dicki assigns the bearish scenario a 48% probability. A break below $1.16 could lead to a retest of the $1.02 to $1.06 range.
With the two scenarios so evenly split, the levels themselves carry much of the significance: $1.25 and the $1.29 Bollinger ceiling frame the upside, while $1.20, $1.16, and the $1.02–$1.06 zone define the downside.
As of 10:19 UTC on Monday, DOT was trading at $1.21. The original report was published by Blockonomi.

