Pi Network hits all-time low of $0.0551 as market correction deepens
Key Takeaways
- •Pi Network's token dropped to a new all-time low of $0.0551 on Tuesday before recovering slightly to trade around $0.0600.
- •PI has declined more than 20% since early November and roughly 98% of its value since external trading began in February 2025, when it traded near $3.
- •The token's market capitalization fell to approximately $692 million, dropping below the $700 million threshold.
- •PI's Open Interest-weighted funding rate turned negative at -0.00048% on Tuesday, and its one-year Sharpe Ratio fell to -1.54, reflecting bearish leveraged positioning and weak risk-adjusted returns.
- •The token trades below its 50-, 100-, and 200-day EMAs with an RSI near 25 in oversold territory, and its outlook stays bearish unless it breaks above the $0.0746-$0.0763 resistance cluster.
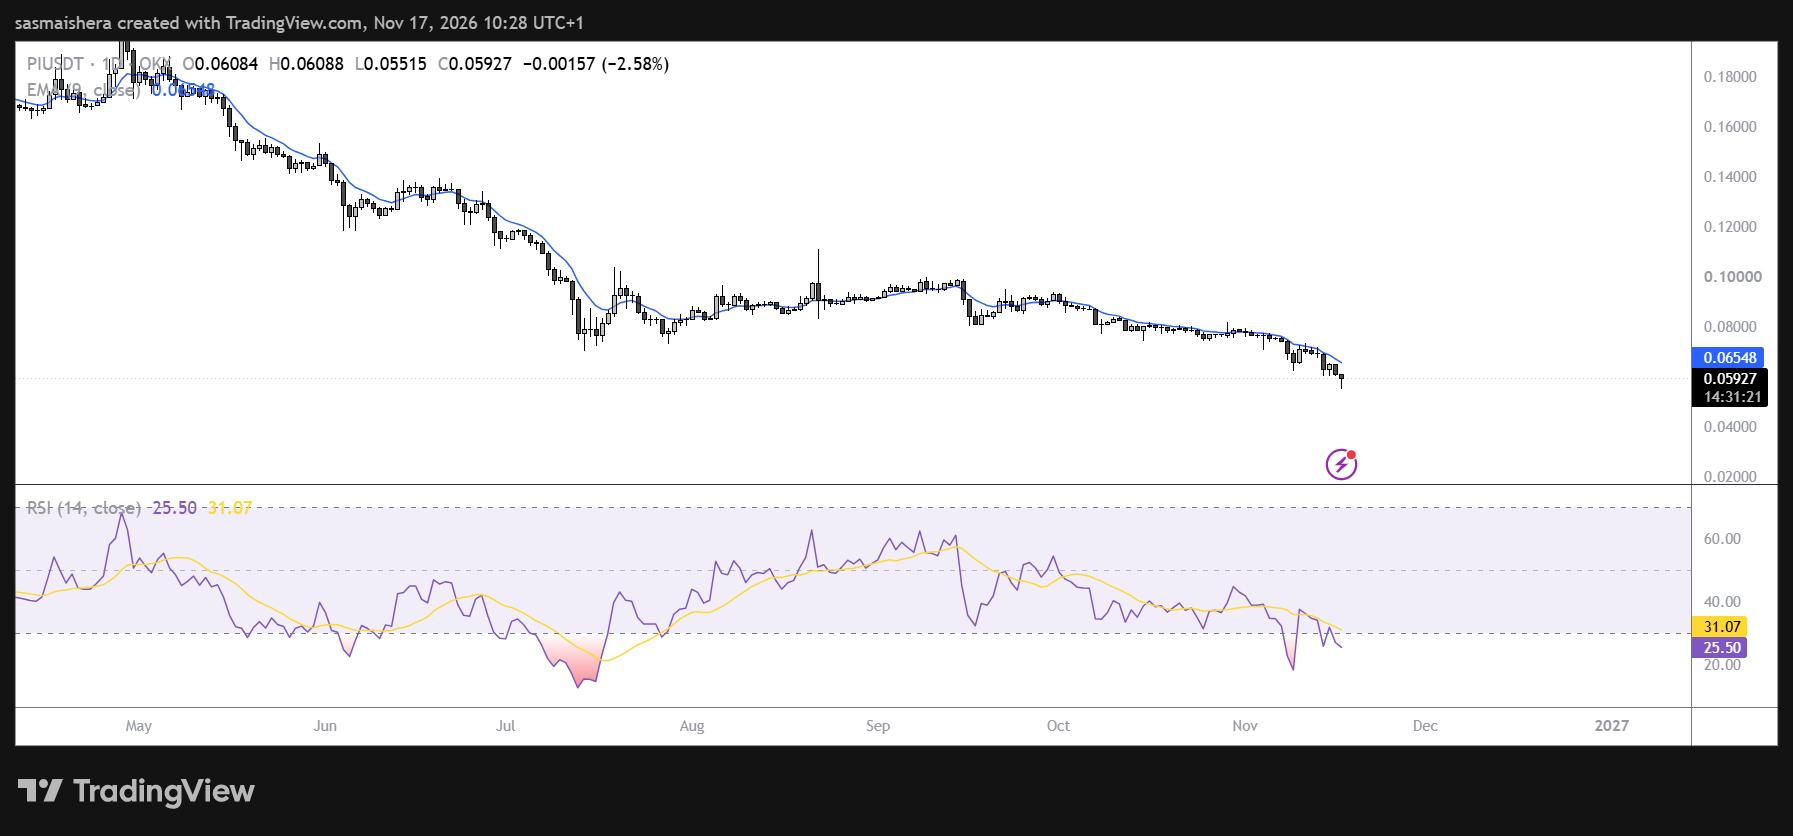
Pi Network (PI) extended its losing streak on Tuesday, sliding to a fresh all-time low of $0.0551 as persistent selling pressure pushed the token deeper into bearish territory. The cryptocurrency subsequently pared some of its losses to trade around $0.0600, although the modest rebound has done little to improve its broader technical outlook.
PI has now declined more than 20% since early November, extending a prolonged downtrend that began in mid-May. The slide comes amid a deepening correction across cryptocurrency markets, but it also extends a much longer decline: PI changed hands near $3 in the days after Pi Network opened its mainnet to external transfers in February 2025, meaning the token has shed roughly 98% of its value since becoming externally tradable. The latest sell-off has also dragged the token's market capitalization below the $700 million threshold, while derivatives data point to weakening sentiment among traders, with negative funding rates signaling a bearish bias in perpetual futures markets.
Record low as market capitalization slips to $692 million
Pi Network's prolonged correction reached another milestone on Tuesday when the cryptocurrency fell to an all-time low of $0.0551. The decline represents a loss of more than 20% since the start of November and reflects sustained selling pressure alongside limited buying demand.
PI's market capitalization has dropped to approximately $692 million, falling below the $700 million level. The project, which built a large following through a smartphone-based mining model that rewarded daily app check-ins before the token could be traded externally, has struggled to establish a sustained recovery since entering its broader downtrend in mid-May. Although temporary rebounds have occurred during the correction, none have managed to reverse the prevailing bearish structure. The latest record low suggests that sellers remain in control, with buyers unable so far to establish a durable support level.
Derivatives data signal mounting bearishness
Positioning in the derivatives market indicates that traders are increasingly preparing for further weakness in Pi Network. According to Blockworks, PI's Open Interest-weighted funding rate turned negative on Monday and declined to -0.00048% on Tuesday.
Funding rates are a core mechanism of perpetual futures markets. When rates are positive, long-position holders generally pay short-position holders; when rates are negative, the flow reverses and shorts pay longs — a configuration that typically reflects a dominant bearish bias among leveraged traders.
Pi Network's weakening performance is also evident in its risk-adjusted return metrics. The token's one-year Sharpe Ratio declined to -1.54 on Tuesday. The Sharpe Ratio measures investment returns relative to a risk-free benchmark while accounting for volatility: a positive reading generally indicates that an asset has generated returns above the benchmark relative to the risk taken, whereas a negative reading suggests the investment has underperformed the benchmark on a risk-adjusted basis. Read together, the negative funding rate and the negative Sharpe Ratio point to weakness in both leveraged positioning and realized, risk-adjusted performance over the past year.
Technical outlook: PI remains below all major moving averages
Pi Network's technical indicators continue to favor sellers despite deeply oversold conditions. After briefly touching its new all-time low of $0.0551, PI traded around $0.0600 on Tuesday, remaining significantly below its major daily Exponential Moving Averages (EMAs).
The 50-day EMA stands near $0.0763, the 100-day EMA is positioned around $0.0850, and the 200-day EMA sits at approximately $0.1083. Together, these moving averages form several layers of resistance above the current market price, and trading beneath all three suggests that PI has yet to establish a meaningful recovery trend.
The daily Relative Strength Index (RSI) stands near 25, placing the token in oversold territory. The RSI is a momentum oscillator that gauges the speed and magnitude of recent price changes, with readings below 30 conventionally regarded as oversold. Meanwhile, the Moving Average Convergence Divergence (MACD) indicator remains negative, reinforcing the prevailing bearish momentum. Taken together, these readings suggest that a short-term recovery is possible, but the broader downtrend remains intact.
Key levels to watch
Pi Network faces several important resistance levels should buyers attempt to reverse the current decline. The first significant barrier stands at horizontal resistance near $0.0746, just below the 50-day EMA around $0.0763. These two levels form an initial resistance cluster that PI would need to overcome to improve its short-term technical outlook.
Beyond this zone, the next important hurdle is the 100-day EMA near $0.0850; a breakout above this moving average could indicate that buying momentum is strengthening. Further resistance follows at $0.0975, and then at the 200-day EMA around $0.1083. Reclaiming the 200-day EMA would represent a more significant technical improvement, potentially signaling that the broader bearish trend is beginning to weaken.
On the downside, the new all-time low at $0.0551 remains the most important immediate reference. A sustained breakdown below this level would establish another record low and leave PI trading without historical price support beneath the market, increasing uncertainty about where buyers might next return. However, the deeply oversold RSI suggests that a temporary recovery remains possible if selling pressure begins to ease. Beyond price levels, the path of PI's funding rate and its market capitalization offer additional gauges of whether that pressure is abating.
For now, Pi Network's near-term outlook remains bearish as long as PI trades below $0.0746 and the 50-day EMA at $0.0763. A breakdown below $0.0551 could extend the correction, while a sustained recovery above the initial resistance cluster would provide an early indication that selling momentum is weakening.
Based on reporting by CoinJournal: Pi Network hits all-time low of $0.0551 amid market correction

