Pi Network dips 1% as futures open interest falls 14%, leaving $0.0801 support at risk
Key Takeaways
- •Pi Network's PI token traded about 1% lower near $0.0823 on Thursday, pausing a selloff that has produced seven consecutive bearish daily closes and leaving the token near its July 31 low of $0.0801.
- •Futures interest fell approximately 14% to $8.94 million from $10.38 million, per CoinAnk data, indicating a weaker derivatives backdrop rather than expanding speculative participation.
- •Santiment data showed PI's social dominance at 0.13% after reaching 0.14% the previous day, reflecting continued visibility that has not yet translated into sustained demand.
- •PI continues to trade below the 23.6% Fibonacci retracement at $0.0827, the 50-day EMA at $0.0902, and the 200-day EMA at $0.1247, keeping the broader technical structure bearish.
- •Momentum indicators remain weak, with the daily RSI near 38, the MACD below its signal line in negative territory, and a sustained break below $0.0801 risking exposure of the Fibonacci anchor near $0.0704.
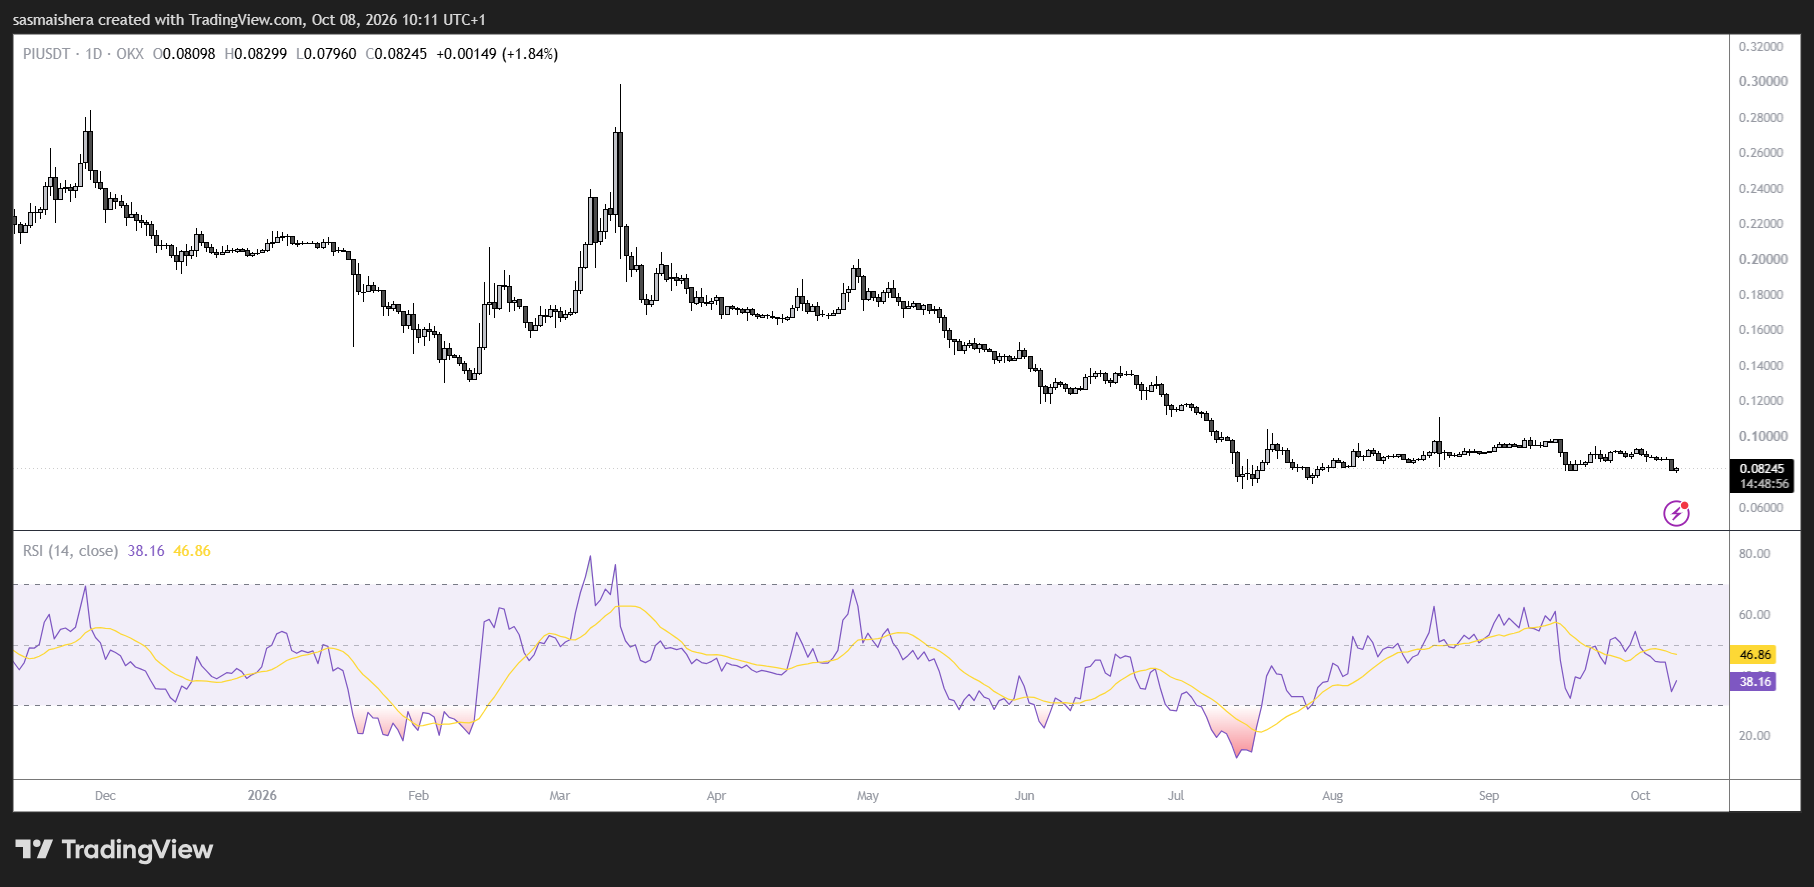
Pi Network's PI token traded about 1% lower near $0.0823 on Thursday, offering a modest pause in a selloff that has now produced seven consecutive bearish daily closes. The slight rebound followed a 7% decline the previous day and came as the token approached its July 31 low near $0.0801. Despite the bounce, PI remained below its key moving averages, leaving buyers with several technical obstacles to overcome before any broader recovery can take hold.
Futures open interest falls approximately 14%
Data from CoinAnk showed Pi Network futures open interest declining to $8.94 million from $10.38 million the previous day. The $1.44 million reduction amounts to an approximately 14% drop in the notional value of outstanding positions. Open interest tracks the total value of futures positions left open on the market, which makes it a common yardstick for how much capital is currently committed to trading an asset.
Lower dollar-denominated open interest can reflect falling prices, closed positions, liquidations, or a combination of those factors. The figures alone do not establish how much of the decline stemmed from traders exiting the market. Nevertheless, the contraction suggests the rebound is unfolding against a weaker derivatives backdrop rather than a clear expansion in speculative participation. Whether open interest stabilizes alongside the price is one of the conditions that would need to change before the current bounce could be read as the start of a broader recovery.
Santiment data showed PI's social dominance at 0.13%, following a rise to 0.14% the previous day, indicating continued discussion about the token despite its recent losses. The metric measures the share of overall cryptocurrency social media conversation directed a single asset, making it a gauge of visibility rather than buying activity. Social attention, however, does not necessarily translate into purchases. Elevated conversation alongside falling open interest presents a mixed picture: PI remains visible to market participants, but that attention has yet to demonstrate a sustained improvement in demand.
Resistance sits near $0.0827
PI's recovery began near $0.0801, but the token continued to trade below the 23.6% Fibonacci retracement at $0.0827, measured on the move from $0.1341 to $0.0704. Fibonacci retracements are derived from fixed ratios of a prior price swing and are widely used to frame potential reversal zones, which is why the $0.0827 line functions as the first test for the rebound. Reclaiming $0.0827 would be an initial step toward strengthening the rebound, and a sustained move above it could bring the 50-day exponential moving average at $0.0902 into focus. The 200-day EMA stands considerably higher at $0.1247. Exponential moving averages weight recent prices more heavily and are commonly used to separate shorter-term momentum from the longer-term trend; trading beneath both averages keeps the broader technical structure bearish despite Thursday's gain.
Momentum indicators reinforced that reading. The daily Relative Strength Index hovered around 38, indicating weak momentum without reaching the conventional oversold threshold near 30, while the MACD line moved below its signal line in negative territory.
Immediate structural support remains at $0.0801. A sustained break below that level would expose the Fibonacci anchor around $0.0704, where buyers could attempt to establish a firmer base.
For now, Thursday's bounce remains tentative. Holding $0.0801 and reclaiming $0.0827 would improve the near-term setup, while continued weakness would raise the risk of another leg lower. How open interest and social discussion evolve from here will show whether the current attention converts into durable participation, or whether the token simply retests the lower end of the range mapped by its recent swing.

