Pi Coin Price Analysis: PI Faces Key Test at $0.09 Resistance and $0.083 Support
Key Takeaways
- •Pi Coin is trading in an ascending channel but remains roughly 97% below its February 2025 peak of about $3.
- •The immediate resistance zone at $0.09-$0.091, formed by the 50-day moving average and the 50% Fibonacci retracement, gives way to a $0.095-$0.096 target if broken on a daily close.
- •The first support band sits between $0.083 and $0.086, with a failure there bringing the 78.6% Fibonacci level near $0.079 into focus.
- •A potential bearish divergence between price and the daily RSI would only gain significance if PI is rejected at resistance and then loses the support band.
- •Pi Network pledged on September 17 to deploy a fix within a week for about 497,000 stalled Fast-Track migration claims, but has not reported how many affected holders completed their claims.
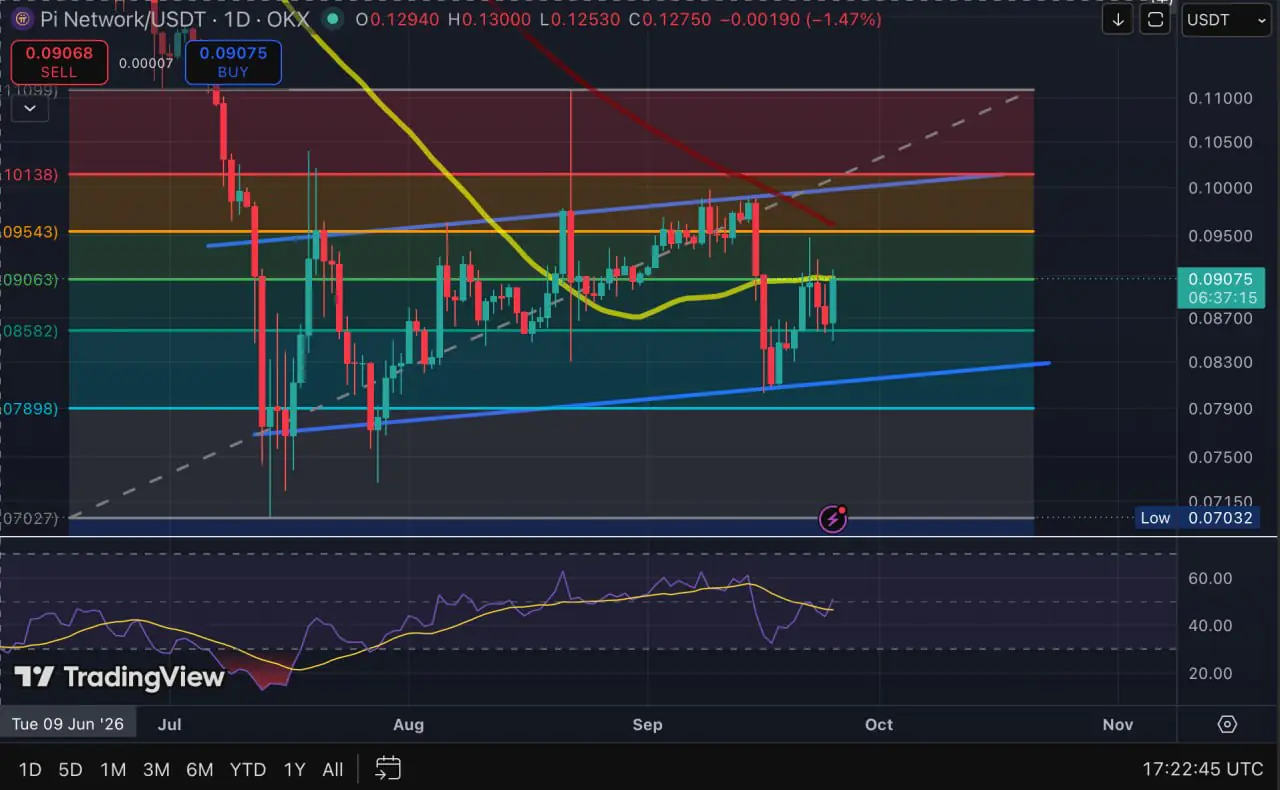
Pi Coin (PI) is climbing within an ascending channel on the daily chart, tracking the broader cryptocurrency market's recovery, albeit with more modest gains. Even so, the token remains roughly 97% below its February 2025 peak near $3. Together, these two facts describe the current move as a short-term recovery embedded within a much larger decline.
The Rebound Meets Its First Barrier
PI has printed a series of higher lows inside the rising channel visible on the daily chart. Price has now arrived at a confluence zone around $0.09–$0.091, where the 50-day simple moving average intersects the 50% Fibonacci retracement near $0.0906. The overlap matters because Fibonacci retracements — proportional reference points derived from the size of the preceding move — and widely followed moving averages are two of the standard tools traders use to frame where a rebound may stall.
That overlap offers traders a clear level to watch at each daily close. A finish above the zone would shift attention toward roughly $0.095–$0.096, where the 100-day simple moving average converges with the 38.2% Fibonacci retracement.
Three scenarios frame the immediate setup:
- Above $0.09–$0.091: the immediate resistance gives way and PI can test the next cluster around $0.095–$0.096.
- Rejected near $0.09: the channel remains valid, but buyers have yet to clear the overhead hurdle.
- Below $0.083–$0.086: the lower channel support and the 61.8% Fibonacci retracement would come under pressure.
Support Begins Around $0.083
A pullback need not land on a single precise figure. The rising lower channel line approaches roughly $0.083, while the 61.8% Fibonacci retracement sits near $0.0858. Together, they form the first support band beneath the current market.
Should that band fail on a daily closing basis, the lower-$0.08 area becomes relevant, with the 78.6% Fibonacci retracement near $0.079 marking the next reference point. This sets up a practical test for the channel: holding its lower boundary preserves the sequence of higher lows, while losing it would weaken the recovery structure.
The Relative Strength Index (RSI), a momentum indicator that compares the magnitude of recent gains and losses, adds a note of caution. PI printed a slightly higher high on the chart while the daily RSI stayed close to its earlier peak, forming a potential bearish divergence. The signal would only carry weight if price is first rejected at the immediate resistance and then loses the support band below.
Why a Break Above $0.09 Would Still Be a Small Step
PI reached approximately $3 in February 2025, according to Coindoo's earlier report on Pi's Protocol v25 upgrade and the post-launch decline that followed. Measured against the chart price near $0.0907, the token remains about 97% below that high.
That context matters for the next technical move. Clearing $0.09 and then $0.095–$0.096 would improve the daily chart and break the first nearby barriers, yet it would still leave PI far below the levels where its longer decline began.
Liquidity is another factor. CoinMarketCap showed roughly $10.6 million in 24-hour PI trading volume at the time of publication, equal to about 1% of its reported market capitalization — a level of turnover at which the volume behind a move can be as telling as the move itself. If PI attempts to push higher, traders can watch whether turnover expands alongside price rather than relying on an isolated intraday move.
The 497,000-Claim Fix Is a Test of Delivery
Pi Network's September 17 update said it would deploy a correction within a week for around 497,000 Fast-Track wallet holders whose migration claims had stalled because their wallets lacked sufficient PI to cover gas fees. The announcement described a user-access problem; it did not identify a direct source of new token demand.
The release also did not state how many affected users had successfully claimed their balances after the correction. Coindoo's coverage of the 497,000 stuck Mainnet claims explains why an announced remedy, a deployed fix, and a completed claim are separate milestones.
That project update is worth tracking alongside the chart. The one-week window the team set for itself gives readers a concrete checkpoint: whether the correction is confirmed as deployed, and whether any follow-up communication quantifies how many of the affected holders completed their claims. A confirmed improvement in claim completion would demonstrate that the bottleneck has been resolved. Whether that fix becomes economically meaningful will depend on how those users — and the wider ecosystem — use PI afterward. Beyond the fix, the Protocol v25 upgrade set out in earlier Coindoo coverage is the project's other visible development milestone to monitor.
For now, the analysis is straightforward: PI has established a cleaner short-term structure than it had earlier in September. The next daily close will reveal whether that structure can extend toward $0.095–$0.096 or remains another bounce within the wider post-launch decline.
This article is provided for informational purposes only and does not constitute financial or investment advice. Cryptocurrency markets are volatile, and technical levels can change quickly.

