PEPE Risks Deeper Correction as Whales Sell 80 Billion Tokens
Key Takeaways
- •Wallets holding between 10 million and 100 million PEPE have sold approximately 80 billion tokens since August 25, while smaller and mid-sized wallets bought only 5.06 billion over the same period.
- •PEPE's derivatives market is sending conflicting signals, with the long-to-short ratio at 1.05 on Thursday while the open-interest-weighted funding rate fell to -0.0067%.
- •The token was rejected at its 200-day EMA near $0.00000364, and momentum indicators such as a declining RSI and a bearish MACD crossover suggest buying pressure is weakening.
- •A daily close below the $0.00000313 support level could confirm a deeper correction toward $0.00000230, representing a decline of roughly 34% from current prices.
- •A successful breakout above the 200-day EMA at $0.00000364 could open the way for a recovery toward the next resistance near $0.00000442.
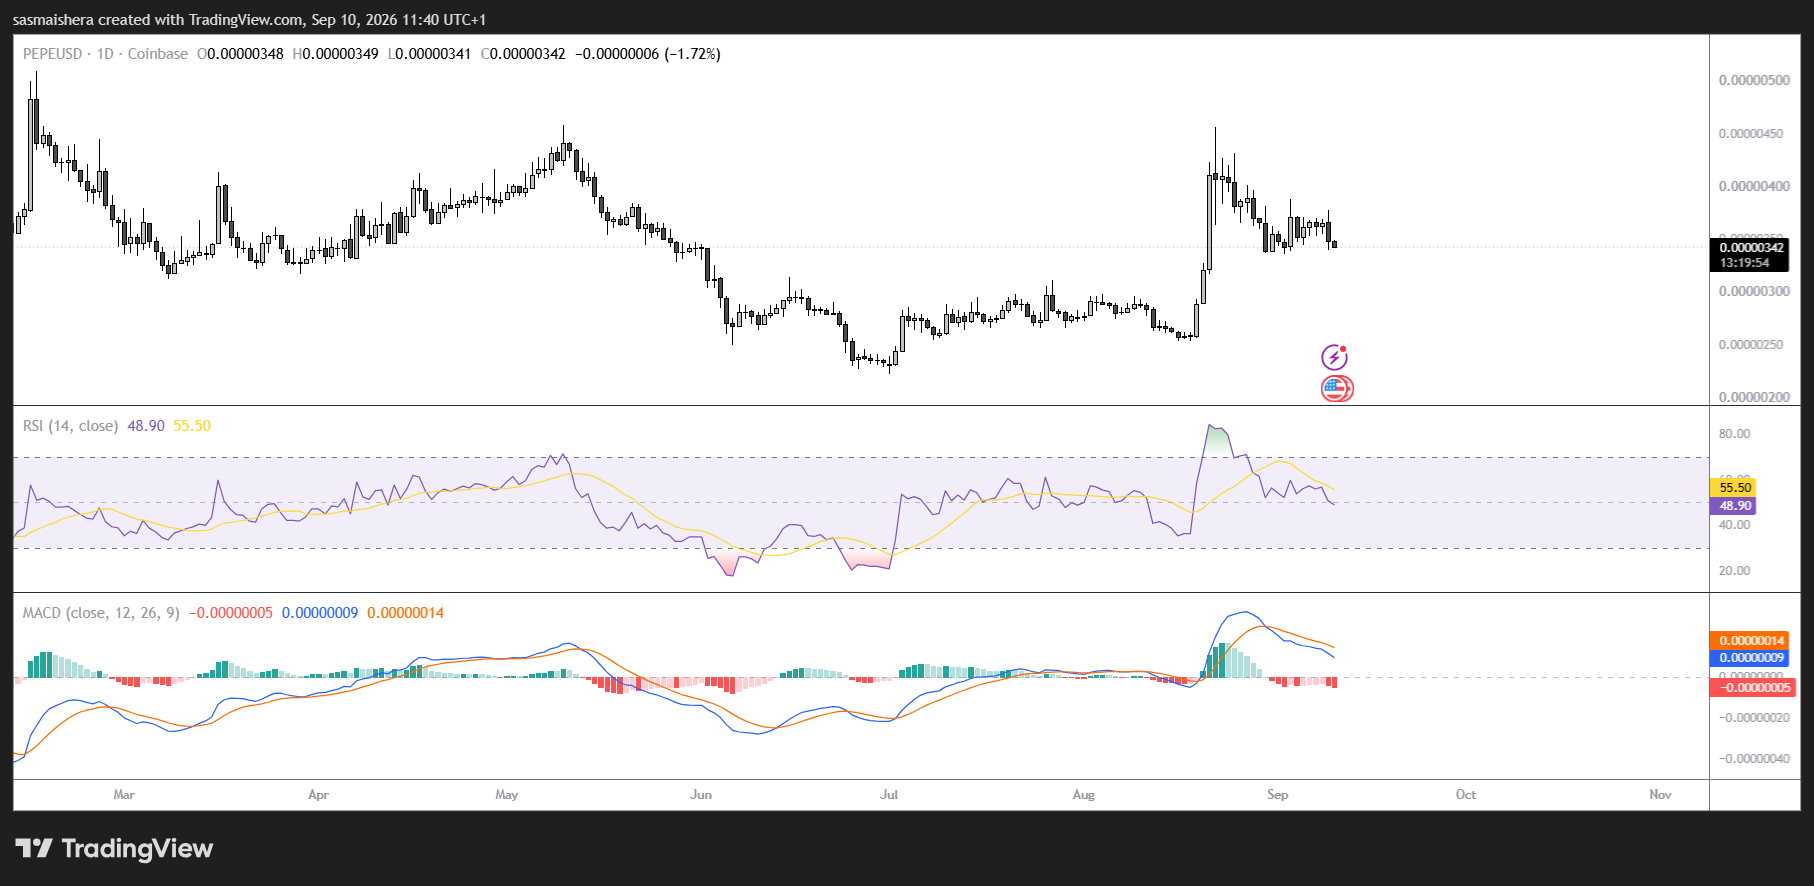
Pepe (PEPE) remained under pressure on Thursday, trading near $0.00000348 after failing to overcome a crucial resistance level. On-chain data shows that large holders have been reducing their positions, a trend that could intensify near-term selling pressure, while conflicting derivatives signals and weakening technical momentum leave the meme coin exposed to a deeper price correction.
PEPE Whales Take Profits After August Rally
Santiment's Supply Distribution data shows that some of PEPE's largest holders have been selling tokens following the meme coin's strong gains in mid-August. Wallets holding between 10 million and 100 million PEPE have collectively offloaded approximately 80 billion tokens since August 25, a substantial distribution that suggests larger investors are locking in profits after the recent rally. Whale flows tend to draw particular attention in the meme coin segment, where valuations are driven more by sentiment and positioning than by protocol fundamentals, making large-holder distribution a closely watched gauge of market conviction.
Over the same period, smaller and mid-sized wallets holding between 100,000 and 10 million PEPE accumulated a combined 5.06 billion tokens. However, buying from these smaller investors represents only a fraction of the amount sold by whales, and the imbalance could limit PEPE's recovery and maintain downward pressure in the short term. Whether the distribution trend among large wallets continues in the coming sessions may offer an early read on their conviction about the token's near-term direction.
Derivatives Market Sends Mixed Signals
PEPE's derivatives market presents a conflicting picture. Data from Coinglass shows the token's long-to-short ratio stood at 1.05 on Thursday, close to its highest level in more than a month. A reading above 1 indicates that long positions outnumber shorts, suggesting that slightly more traders expect PEPE to rally. Positioning metrics like this are among the most closely watched derivatives indicators, offering a real-time snapshot of how leveraged traders are leaning.
Funding-rate data, however, points to a more cautious market. PEPE's open-interest-weighted funding rate turned negative on Wednesday and fell to -0.0067% on Thursday. A negative funding rate means short-position holders are paying traders with long positions, a condition that typically reflects stronger bearish positioning and contradicts the optimism shown by the long-to-short ratio. The split between the two metrics underscores the uncertainty in leveraged positioning, leaving traders without a clear directional consensus.
PEPE Rejected at 200-Day EMA Resistance
PEPE traded around $0.00000348 on Thursday after facing rejection at its 200-day exponential moving average near $0.00000364 during the previous session. The failed breakout highlights the 200-day EMA as an important barrier that bulls must overcome to regain control of the trend. The 200-day EMA is one of the most widely followed long-term trend indicators in technical analysis, and price behavior around it is often used to gauge whether an asset remains in a broader bullish or bearish phase.
Momentum indicators also show that buying pressure is weakening. The Relative Strength Index is moving lower toward the neutral level of 50, a threshold that typically marks the balance point between bullish and bearish momentum, suggesting the earlier bullish momentum is fading. Meanwhile, the Moving Average Convergence Divergence indicator produced a bearish crossover last week that remains in place, reinforcing the risk of further losses.
On the downside, PEPE's 50-day and 100-day EMAs provide an initial support zone near $0.00000320. The next important horizontal support sits around $0.00000313. A daily close below this area could confirm a deeper correction and expose PEPE to its next major support near $0.00000230, a move that would represent a decline of approximately 34% from the current price.
Conversely, PEPE must close above the 200-day EMA at $0.00000364 to weaken the bearish outlook. A successful breakout could open the door to a recovery toward the next daily resistance at approximately $0.00000442. With the token compressed between these well-defined levels, upcoming daily closes around $0.00000313 and $0.00000364 are the key markers for gauging which scenario unfolds.
This article is based on CoinJournal's original coverage.
