US Pending Home Sales Drop to Second-Lowest on Record; West Plunges to Record Low
Key Takeaways
- •National Association of Realtors data showed pending sales of existing US homes fell 2.3% in July from June to the second-lowest level on record, tied with July 2024, and declined 2.2% year over year.
- •All four Census regions recorded monthly declines, with the West plunging 7.7% to a new record low for the series and the South and Northeast also falling sharply.
- •Pending sales were down 36% from July 2021, down 33% from the Julys of 2018 and 2019, and 9% below July 2010 Housing Bust levels, marking a fourth year of sales mostly below Housing Bust lows.
- •The market is contending with the highest supply of existing single-family homes in ten years, while high contract cancellation rates add uncertainty to the pending-sales signal.
- •Freddie Mac data placed July mortgage rates between 6.4% and 6.7%, a range unchanged since September 2022, and the cited analysis argued that rates are historically normal while home prices and carrying costs have overshot what the market can bear.
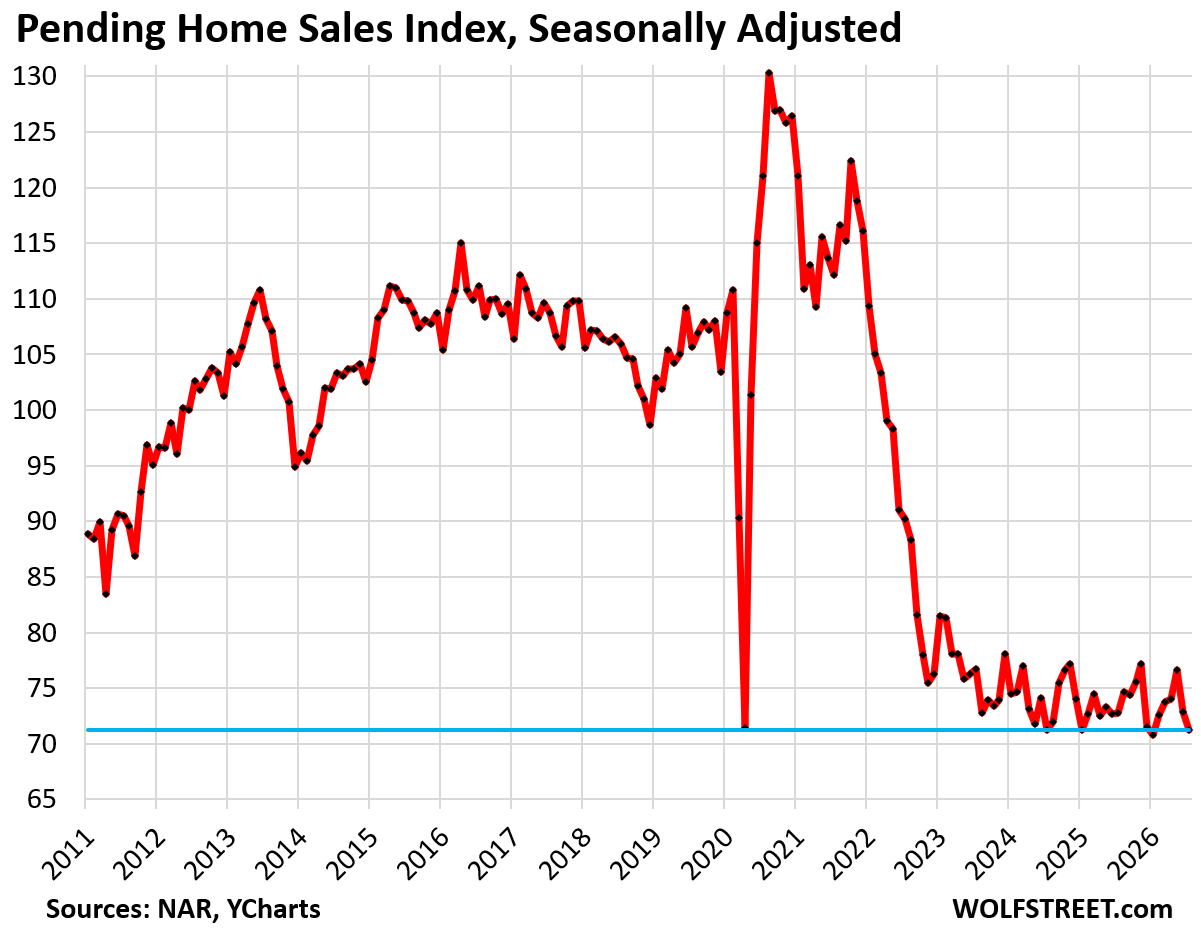
Pending sales of existing US homes fell 2.3% in July from June on a seasonally adjusted basis, reaching the second-lowest level on record — a position shared with July 2024 — according to data released by the National Association of Realtors (NAR). The record low in the series was set in January 2026.
Measured against the already-depressed levels of July 2025, pending sales dropped 2.2% year over year. The NAR's pending-sales series dates only to July 2010, while its closed-sales data reaches back to the 1980s. The index is benchmarked so that a level of 100 equals average contract activity in 2001.
Sales declined in all four Census regions in July, plunging to record lows in the West and falling sharply in the South and Northeast.
The longer-term comparisons underscore the depth of the slump. Pending sales are down 36% from July 2021, down 41% from 2020, and down 33% from the Julys of 2018 and 2019. Even against July 2010, during the Housing Bust, sales are 9% lower.
The housing market is now completing a fourth year in which sales have remained mostly below the lows of the Housing Bust, stuck near the bottom after the home-price explosion that ran from mid-2020 through mid-2022, and now facing the highest supply of existing single-family homes in ten years.
The NAR's pending-home-sales metric tracks contracts signed in July that have not yet closed and could still be canceled for any reason; cancellation rates have been running high. Pending sales provide a preview of what is coming in terms of closed home sales; under NAR's methodology, most contracts typically close within one to two months of signing, so July's signings feed into the closed-sales reports for the months just ahead.
Pending home sales by region
West. Pending sales plunged 7.7% in July from June, seasonally adjusted, to a new record low in the data. Compared with July in prior years: -7.1% versus 2025, -8.2% versus 2024, -11.9% versus 2023, -25.0% versus 2022, -47.4% versus 2021, and -43.9% versus 2019.
South. Pending sales dropped 2.2% month over month, seasonally adjusted, with only three other months on record as low or lower. Compared with July in prior years: -3.0% versus 2025, +0.5% versus 2024 (the second-lowest month on record), -9.9% versus 2023, -20.6% versus 2022, -36.2% versus 2021, and -32.2% versus 2019.
Northeast. Pending sales fell 2.0% month over month, seasonally adjusted. Compared with July in prior years: -0.2% versus 2025, -0.3% versus 2024, +2.2% versus 2023, -18.6% versus 2022, -31.2% versus 2021, and -30.7% versus 2019.
Midwest. Pending sales declined 0.7% month over month, seasonally adjusted, following an 8.9% plunge in the prior month. Compared with July in prior years: +1.7% versus 2025, +5.8% versus 2024, -4.2% versus 2023, -20.6% versus 2022, -30.4% versus 2021, and -26.2% versus 2019.
Mortgage rates in historical context
Mortgage rates in July were in the 6.4% to 6.7% range, according to Freddie Mac's average weekly mortgage-rate data, a band they have occupied since September 2022. For reference, the same Freddie Mac series set its record low of 2.65% in January 2021, during the pandemic-era housing boom.
Wolf Street noted that in the decades before 2009 — before the Federal Reserve's quantitative easing and zero-interest-rate policy began to distort the markets — mortgage rates were about as high or much higher than today's levels. Viewed in that historical context, the publication argued, current rates are fairly normal and not too high; what is too high is inflation, and the housing market — buyers, sellers, and the entire industry in between — needs to get used to those rates.
According to the analysis, mortgage rates appear high only in the context of the QE era, when the Fed "printed" trillions of dollars to purchase trillions of dollars of Treasury securities and mortgage-backed securities (MBS) in order to repress interest rates and mortgage rates, and thereby inflate asset prices and home prices — a dynamic that eventually triggered the worst consumer-price inflation in 40 years and the worst home-price explosion on record.
As a result, the analysis contended, home prices have overshot what the market can bear, have inflated homeowners' insurance premiums and other carrying costs that sap consumer spending elsewhere, and have become a liability for the housing market and for the economy.
Related coverage: Sales of Existing Single-Family Homes Sink Deeper into Mud, Supply Jumps to 10-Year High, Condo Supply at 14-Year High
Source: Wolf Street