PCE Price Index Preview and EUR/USD Technical Analysis
Key Takeaways
- •The Bureau of Economic Analysis will release the July PCE price index report on Wednesday, August 26, ahead of the Jackson Hole Symposium and the September FOMC interest rate decision.
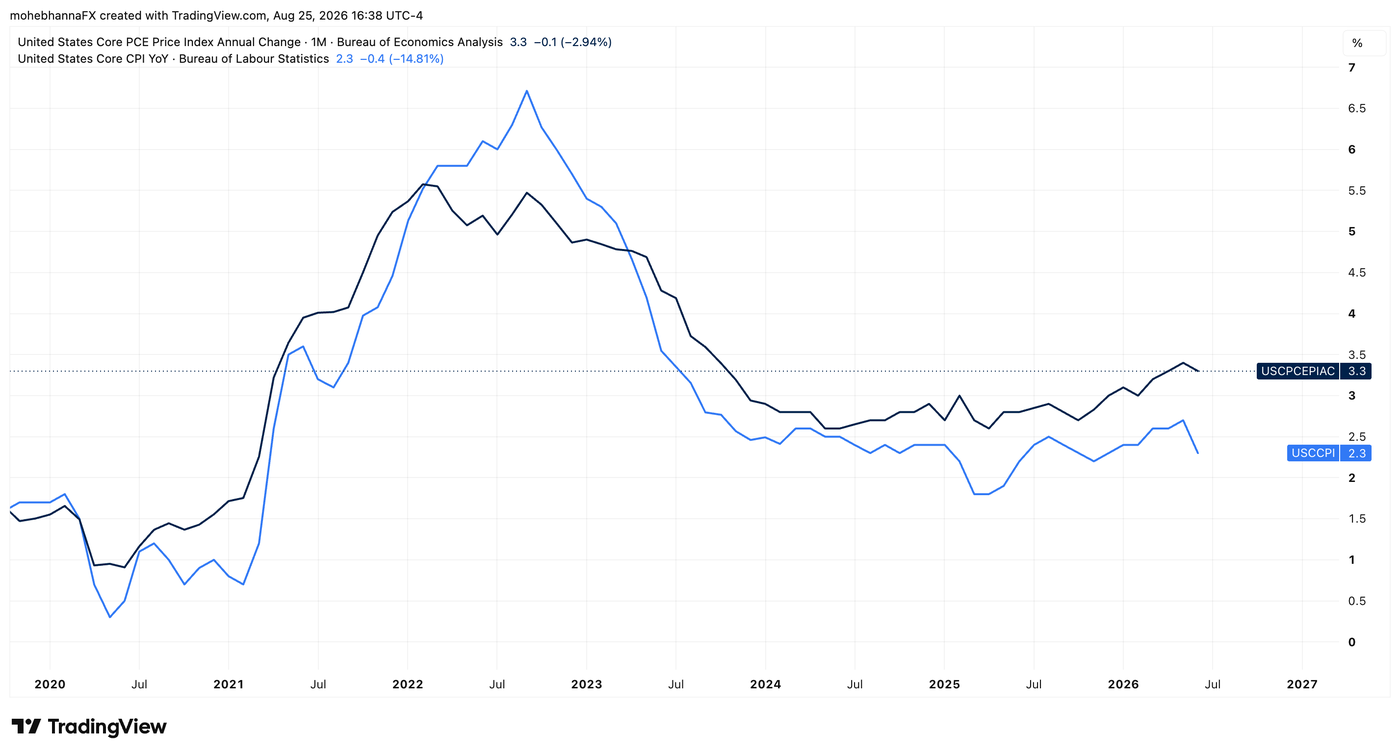
- •Economists forecast headline PCE inflation to ease to 3.6% year over year, while core PCE is expected to hold steady at 3.3% year over year.
- •Core PCE is the Federal Reserve's preferred inflation gauge, as the central bank's 2% inflation objective is formally expressed in terms of the PCE price index.
- •Alongside inflation data, the personal income and outlays report includes personal income, disposable personal income, personal spending, and the personal savings rate.
- •EUR/USD completed an inverted complex head-and-shoulders pattern on August 19 and rose to near 1.1710, with immediate resistance at 1.1737 and momentum indicators signaling overbought conditions.
Key takeaways
The Bureau of Economic Analysis will release the July personal consumption expenditures (PCE) price index report on Wednesday, August 26, a reading that is closely watched as a key signal for Federal Reserve monetary policy.
Consensus estimates suggest headline PCE inflation will ease slightly to 3.6% year over year, while core PCE is expected to remain unchanged at 3.3% year over year.
The report will also include several important household financial measures, including personal income, disposable personal income (DPI), personal spending (outlays), and the personal savings rate.
In EUR/USD, the pair has moved above a complex head-and-shoulders neckline and key pivot levels toward 1.1710 after the FOMC minutes, with immediate resistance at 1.1737, the weekly R1 level, while technical indicators remain in overbought territory.
The upcoming personal consumption expenditures (PCE) price index report, scheduled for release by the U.S. Bureau of Economic Analysis on Wednesday, August 26, is set to be a focal point for investors assessing the Federal Reserve’s next policy steps. The PCE measure, and especially core PCE, is the Fed’s preferred inflation gauge for monetary policy decisions. That preference is formal: the Fed’s 2% inflation objective is expressed in terms of the PCE price index, and the core reading, which strips out volatile food and energy components, is the one policymakers lean on most when judging underlying price pressure. Compared with the better-known consumer price index (CPI), the PCE also captures a broader range of household spending and updates its weights as spending patterns shift, which is why it serves as the benchmark for policy.
Economists expect July headline PCE inflation to edge down to 3.6% year over year, while core PCE is projected to hold steady at 3.3% year over year. The report will be closely examined for signs that underlying price pressures are easing or remaining persistent.
The release comes after recent FOMC meeting minutes showed a 6–3 split among members and arrives just before the Jackson Hole Symposium, the Federal Reserve Bank of Kansas City’s annual central banking gathering, and the September FOMC interest rate decision.
Key measures in the personal income and outlays report
The PCE price index is part of the broader personal income and outlays report, which the Bureau of Economic Analysis publishes at the same time. Along with the inflation data, the report includes several widely watched measures of household finances, figures that matter beyond inflation since personal consumption is the largest component of U.S. gross domestic product:
- Personal income: Total income received by individuals from all sources, including wages, investment returns, and government transfers such as Social Security.
- Disposable personal income (DPI): Income remaining after current tax payments, which is a key measure of consumer spending power.
- Personal spending (outlays): Real and nominal data showing how much consumers spent on goods and services, including durable and nondurable goods.
- Personal savings rate: Personal savings as a percentage of disposable income, showing the amount of financial buffer households are maintaining.
Gain unique insights through live market analysis with OANDA’s market experts:
EUR/USD daily chart technical analysis
After breaking down from a medium-term ascending channel in July 2025, EUR/USD entered a broadening wedge formation, marked by blue trendlines on the chart. The pair later posted a positive stochastic divergence in June 2026, followed by an exhaustion gap in July, which established structural support above the monthly S1 pivot at 1.1406.
A rally then carried EUR/USD toward the 1.1550 area, where the pair consolidated between August 1 and August 19, 2026, beneath a cluster of resistance. The move higher followed the release of dovish FOMC meeting minutes, as shown on the chart.
That resistance zone included the neckline of the inverted complex head-and-shoulders pattern, the monthly pivot point (PP) at 1.1601, the first monthly support (S1) at 1.1589, and both the 9-period exponential moving average (EMA9) and the 9-period simple moving average (SMA9). That resistance has now turned into support, highlighted by the blue circle on the chart.
The inverted complex head-and-shoulders bottoming pattern was completed on August 19. A decisive breakout above the neckline helped drive price through the weekly PP at 1.1650 and the monthly R2 at 1.1671, before EUR/USD reached a session high near 1.1710. The breakout arrives amid a busy macro calendar, with the PCE report due Wednesday and the Jackson Hole Symposium immediately ahead.
Immediate resistance is now located at 1.1737, the weekly R1 level, followed by 1.1795, the monthly R3 level. In classical pivot-point analysis, these levels are calculated from the previous period’s high, low and close, with R1 through R3 marking progressively higher resistance barriers above the pivot.
Momentum indicators suggest the move is extended. By standard convention, Stochastic readings above 80 and RSI readings above 70 are treated as overbought territory. The 14-period Stochastic (14, 1, 3) is deep in overbought territory at 85.45, while the 14-period Relative Strength Index (RSI 14) is rising at 73.19.
Technical abbreviations
EMA: Exponential Moving Average
MA: Moving Average
RSI: Relative Strength Index
% K: Fast Stochastic
%D: Slow Stochastic
MACD: Moving Average Convergence Divergence
PP: Pivot Point
S: Support
R: Resistance
Opinions are those of the author and do not necessarily reflect the views of OANDA Business Information & Services, Inc. or any of its affiliates, subsidiaries, officers, or directors. This publication is provided for informational and educational purposes only. For reproduction or redistribution of content from MarketPulse, please refer to the MarketPulse Terms of Use: https://www.marketpulse.com/terms-of-use/
Visit https://www.marketpulse.com/ to find out more about the beat of the global markets. © 2026 OANDA Business Information & Services Inc.

