Passive Investing Statistics 2026: ETF Assets Top $24 Trillion as Index Funds Widen Lead Over Active
Key Takeaways
- •Global ETF assets climbed above $24 trillion in August 2026, a gain of more than $4 trillion, or roughly 21%, from the $19.85 trillion recorded at the end of 2025.
- •ETFs absorbed about $1.96 trillion in net inflows through August 2026, already reaching roughly 83% of the record full-year total of $2.37 trillion set in 2025.
- •U.S. passive mutual funds and ETFs surpassed active funds by assets for the first time in 2024, with the gap widening due to lower costs, diversification, and active managers' difficulty beating the market after fees.
- •SPIVA data show about 79% of active U.S. large-cap equity funds underperformed the S&P 500 in 2025, and roughly 90% trailed it over the 15 years through June 2026.
- •Actively managed ETFs reached about $2.59 trillion worldwide by July 2026 and captured $590.5 billion in net inflows in the first seven months of the year, exceeding any previous full year.
Passive investing has evolved from a niche strategy into a central pillar of global financial markets. Index mutual funds and exchange-traded funds (ETFs) now hold trillions of dollars in stocks and bonds, and in the United States passive funds hold more assets than their actively managed counterparts.
The global ETF industry has also reached record scale. Worldwide ETF assets climbed above $24 trillion for the first time in August 2026, after beginning the year at roughly $19.85 trillion. Investors committed nearly $2 trillion in net new money during the first eight months of the year.
Not every ETF is passive, however. Actively managed ETFs have become one of the fastest-growing segments of asset management and now hold about $2.6 trillion worldwide. Even so, traditional index investing remains the foundation of the industry.
According to Morningstar, assets in U.S. passive mutual funds and ETFs surpassed those in active funds for the first time during 2024, and the gap has continued to widen since. The drivers are lower costs, broad diversification, and the persistent difficulty active managers face in beating the market after fees.
This article draws on data from the Investment Company Institute (ICI), Morningstar, ETFGI, and S\u0026P Dow Jones Indices, covering assets, flows, ownership, performance, and the rise of active ETFs.
The Main Figures, and Why They Overlap
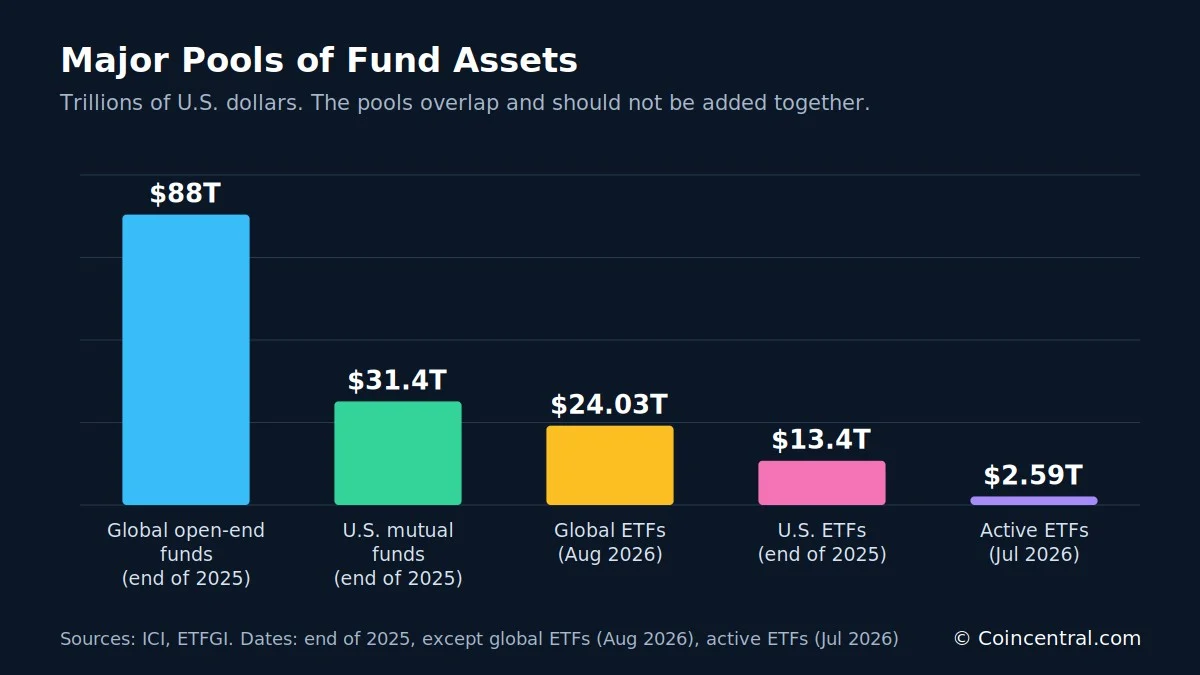
The statistics cited here cover different parts of the fund industry: some refer to the entire fund universe, while others apply only to ETFs or to passive funds specifically. Taken together, they point to two distinct but related trends. Passive funds continue to gain ground on active funds, and the ETF structure keeps expanding for both passive and active strategies.
The asset pools described below overlap and should not be added together. U.S. ETFs, for instance, are a subset of the global ETF total, and ETFs in turn form part of the wider fund industry.
What Is Passive Investing and Why Do Investors Choose It?
Passive investing aims to match an index rather than beat the market. An index fund holds the securities in its benchmark in roughly the same proportions as the benchmark itself. An S\u0026P 500 index fund offers a simple illustration: when Apple, Microsoft, or Nvidia becomes a larger share of the index, the fund automatically owns more of it. No portfolio manager decides whether a stock looks too expensive.
Active investing works differently. A manager selects securities and determines how much of each to hold, with the goal of outperforming a benchmark.
Passive funds take two forms: index mutual funds and index ETFs. An ETF is a type of investment vehicle—some ETFs are passive, while others are actively managed.
Cost Is the Main Advantage
The principal economic advantage of passive funds is cost. A passive S\u0026P 500 fund does not require large teams of analysts studying hundreds of companies, and some broad index products now charge only a few basis points per year.
Consider two hypothetical funds that each earn 8% annually before fees—one charging 0.05% a year, the other 1%. On a $10,000 investment held for 30 years, the first grows to roughly $99,200, while the second reaches about $76,100. The gap of approximately $23,100 comes entirely from fees. The calculation assumes the net return compounds each year and ignores taxes.
Passive funds also begin with a structural edge: a passive manager does not need to beat the market before costs merely to match it after costs.
Global ETF Assets Have Passed $24 Trillion
ETF growth offers a clear picture of the broader shift. ETFGI reported worldwide ETF assets of $19.85 trillion at the end of 2025. By August 2026, the total had reached $24.03 trillion—a gain of more than $4.1 trillion in eight months, or roughly 21%.
That increase does not mean investors deposited the full amount. Asset totals reflect net investor flows together with stock market gains, bond market movements, and currency fluctuations.
The largest jump in the data came in May, when assets rose from $21.91 trillion in April to $23.08 trillion, an increase of $1.17 trillion. The March figure was absent from the source data, so the change between February and April cannot be split by month. Growth was nearly flat from May through July, with totals of $23.08 trillion, $23.09 trillion, and $23.11 trillion, before August added roughly $0.92 trillion.
Even accounting for market effects, investor demand was strong—as the flow data below shows.
ETF Inflows Are Close to $2 Trillion in 2026
Global ETFs absorbed about $1.96 trillion in net inflows through August 2026. The full-year record for 2025 was $2.37 trillion, meaning 2026 had already reached about 83% of that mark with four months remaining.
The pace accelerated over the summer. Inflows grew by roughly $260 billion from May to June, about $380 billion from June to July, and around $250 billion from July to August.
ETFs have also continued to attract money through volatile conditions. By August 2026, the industry had recorded 88 consecutive months of net inflows—more than seven years.
The U.S. ETF Market, Household Ownership, and Retirement Accounts
The United States remains the world's ETF market. The ICI reports that U.S.-domiciled ETFs held approximately $13.4 trillion at the end of 2025, spread across 4,495 funds. ETFs accounted for about 30% of assets managed by U.S. investment companies. Mutual funds are still larger overall, but ETFs have grown from a niche product several decades ago into a major component of the regulated fund market.
Ownership is broadening as well. The ICI estimates that 19.8 million U.S. households—about 15%—owned ETFs in 2025, and roughly 86% of those households also owned mutual funds.
Overall fund ownership is considerably wider. About 76 million households, or 56.4%, owned U.S.-registered funds, and an estimated 128.7 million individuals held them. ETF-owning households therefore represent roughly one in four fund-owning households.
Retirement Saving Feeds Passive Growth
Retirement accounts help explain the expansion of passive funds. U.S. retirement assets reached about $49.1 trillion at the end of 2025, and roughly 74% of households held some form of tax-advantaged retirement savings. Individual retirement accounts (IRAs) and defined-contribution plans such as 401(k)s together made up about 68% of the retirement market.
These accounts typically hold index funds, target-date funds, ETFs, and passive bond funds. Because contributions arrive with every paycheck, they generate a steady stream of long-term money flowing into investment funds.
How Much of the Stock Market Do Funds Own?
The ICI estimates that U.S.-registered investment companies owned about 33% of U.S. corporate equity at the end of 2025, with smaller shares of other markets. The 33% figure should not be described as passive funds owning one-third of the stock market: it includes both active and passive investment companies, and the true passive share is smaller.
The distinction matters because claims that index funds own half the stock market often conflate two separate measures—one being the passive share of fund assets, the other the passive share of all corporate equity.
The Debate Over Index Effects
The rise of indexing has attracted criticism. A passive fund buys a stock because it belongs to an index, not because a manager considers it undervalued. Critics argue this could weaken price discovery, channel more money toward the largest companies, increase market concentration, force trading around index changes, and hand greater voting influence to large asset managers.
These are legitimate research questions, but the evidence that passive investing has broken price discovery remains disputed. Active investors still set prices at the margin by deciding what to buy and sell, while passive funds generally accept those prices.
Index changes can nonetheless move large sums. Reuters estimated that Strategy could face roughly $2.8 billion in passive-fund selling if MSCI removes it under proposed eligibility changes. A change in index rules can compel buying or selling without any portfolio manager making a decision.
Most large index funds weight companies by market value, so a company's weight rises as its value rises. Because U.S. stock returns have been concentrated in technology and AI-related companies, those firms carry large index weights. Passive funds did not create those valuations—index weights climbed because investors across the market valued the companies more highly. Cause and effect run in both directions, making it difficult to claim that index funds pushed prices up.
Most Active Large-Cap Funds Trail the S\u0026P 500
The strongest case for passive investing rests on performance data. S\u0026P Dow Jones Indices publishes the SPIVA reports, which measure active funds against their benchmarks.
In 2025, 79% of active U.S. large-cap equity funds underperformed the S\u0026P 500—about eight in ten. In the first half of 2026, the share fell to 67%, roughly two in three.
Long-term results are even tougher on active managers. Through June 2026, 89.3% had underperformed over five years, 83.3% over 10 years, and 90.5% over 15 years—the equivalent of about nine in ten funds.
These figures do not prove that no active manager can win. They show that identifying the winners in advance is extremely difficult.
Morningstar Data: One in Four Active Funds Wins Over 10 Years
Morningstar approaches the question differently. Its Active/Passive Barometer compares active managers with passive funds in the same category, rather than only against an index.
At mid-2026, Morningstar's U.S. database covered 9,226 funds holding about $29 trillion. Slightly more than 40% of active funds survived and outperformed their passive peers over the previous year. Over the decade to June 2026, only about 25% did.
Fund closures matter in studies of this kind. Poorly performing funds are frequently merged or shut down, so an analysis limited to surviving funds can make active management look better than it actually was. Although Morningstar's and SPIVA's methods differ, the results point the same way: the longer the period, the smaller the share of active funds that beat low-cost alternatives.
Passive Funds Take Most New Equity Money
Fund flows reveal the shift in real time. Morningstar reports that passive strategies continue to attract the majority of new money across key U.S. asset classes, especially stocks, while active U.S. stock funds have experienced steady long-term outflows.
Europe displays a similar pattern. In the second quarter of 2026, passive equity funds took in €89.9 billion, while active equity funds lost €17.8 billion. Across all asset classes, passive European funds drew roughly €128.5 billion during the quarter. The movement toward passive investing is clearly not confined to the United States.
Active ETFs Are Growing, and ETFs Are Not All Passive
For years, "ETF" and "passive investing" were nearly synonymous. That is no longer the case. Morningstar reports that actively managed ETFs accounted for about 12.5% of all ETF assets in June 2026.
ETFGI measured worldwide active ETF assets at $2.59 trillion in July 2026, up 35.6% since the end of 2025—implying a starting point of roughly $1.9 trillion. Active ETFs drew $590.5 billion in net inflows during the first seven months of 2026, already exceeding any previous full year.
Why Investors Like the ETF Wrapper
Many investors favor the ETF structure even when they want active management. ETFs can offer intraday trading, portfolio transparency, tax efficiency, lower operating costs, easy brokerage access, and no traditional mutual fund minimums.
Asset managers have responded with active equity ETFs, bond ETFs, options strategies, income strategies, buffers, and thematic funds. ETFGI counted more than 1,200 active ETF launches worldwide in the first seven months of 2026.
The debate has accordingly shifted: it is now partly passive versus active, and partly ETF versus mutual fund. Passive funds still hold most of the assets, but active strategies are increasingly moving into the ETF wrapper, and some investors may pair low-cost core passive holdings with specialized active strategies.
The Bottom Line
Passive investing is now a central feature of modern finance. U.S. passive mutual funds and ETFs overtook active funds by assets during 2024, and the gap has kept widening. Global ETF assets grew from about $19.85 trillion at the end of 2025 to more than $24 trillion by August 2026, with nearly $2 trillion of net new money entering ETFs in those eight months.
In the United States, ETFs hold about $13.4 trillion and 19.8 million households own them. The broader fund industry owns roughly one-third of U.S. corporate equities—a figure that includes both passive and active funds.
Performance data explains much of the shift. About 79% of active U.S. large-cap funds trailed the S\u0026P 500 in 2025, and about 90% trailed it over 15 years. Morningstar finds that only about one in four active funds survived and beat passive peers over the decade to June 2026.
The question ahead is less whether passive investing keeps growing than what its growth means. Large pools of index-tracking money may influence fees, competition, corporate ownership, market concentration, and price discovery. Active ETFs add a further wrinkle, since the ETF label no longer implies passive management.
Sources
- Investment Company Institute: 2026 Investment Company Fact Book
- ICI: U.S. ETF Market FAQs, April 2026
- Morningstar: U.S. Active/Passive Barometer, Mid-Year 2026
- Morningstar: Active vs. Passive Investing
- Morningstar: State of U.S. ETFs in 2026
- ETFGI: Global ETF Industry, August 2026
- ETFGI: Global ETF Industry 2025
- ETFGI: Global Active ETF Industry, July 2026
- S\u0026P Dow Jones Indices: SPIVA U.S. Year-End 2025
- S\u0026P Dow Jones Indices: SPIVA U.S. Mid-Year 2026

