Orochi Network (ON) Trades Near $0.08860 as 2026–2030 Forecasts Weigh Path to $1
Key Takeaways
- •ON gained 4.46% over the past 24 hours to trade near $0.08860, yet its RSI of 35.92 remains below both the neutral 50 threshold and its 46.87 moving average, signaling that selling momentum still dominates.
- •November's rally, which lifted ON above $0.200 and briefly approached $0.300, was reversed by a sharp correction that pushed the token back below $0.100.
- •Immediate resistance for ON sits at $0.100 and $0.120, while key support lies near $0.080 and the lower Bollinger Band at $0.066088.
- •Widely stretched Bollinger Bands spanning $0.066088 to $0.229941 point to elevated volatility, suggesting substantial price swings remain possible while the recovery is tested.
- •A long-term forecast from Hokanews projects ON between $0.180 and $1.100 by 2030, with the most optimistic scenario requiring roughly an 11.29-fold increase from the current price.
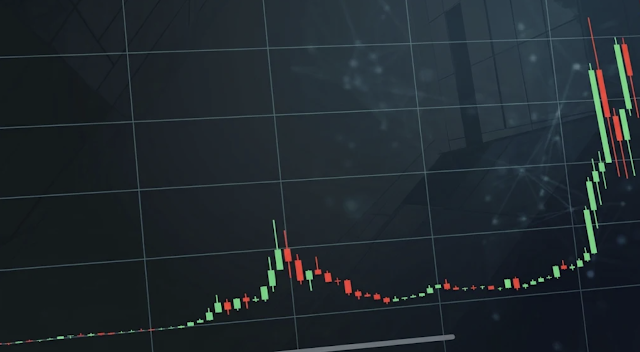
Orochi Network (ON) is changing hands near $0.08860 after a 4.46% gain over the past 24 hours, yet technical readings suggest the token has not yet overcome the selling pressure that drove its November correction. ON remains below the middle Bollinger Band at approximately $0.14801, and a Relative Strength Index (RSI) of 35.92 indicates that bearish momentum still dominates. For readers tracking the token, these two indicators offer a standardized way to assess whether short-term gains are accompanied by broader momentum or remain isolated moves.
Data from TradingView's daily chart recorded an intraday high of $0.092356 and a low of $0.084281. Although the latest session points to some buying activity, the RSI remains below its moving average of 46.87, suggesting the recovery has not yet translated into a broader shift in market momentum.
Orochi Network Price Action and Key Levels
Sellers maintained pressure through August, dragging ON from above $0.300 toward the $0.200 region. Several rebound attempts surfaced during the month, but buyers failed to build a lasting uptrend as lower highs kept forming. A sequence of lower highs is a pattern chart readers typically associate with seller control, since each rally fails at a progressively lower price point.
The decline carried into September, pushing the token below $0.180 and closer to the $0.100 mark. Occasional bullish sessions punctuated the slide, though the overall market structure stayed weak.
October brought relative stability, with ON trading mainly between $0.100 and $0.140. Buying activity picked up toward the end of the month, delivering a modest recovery before volatility returned in November.
November initially saw ON climb back above $0.200, with an extended upper wick briefly approaching $0.300. That rally, however, met substantial selling pressure and was followed by a sharp correction that knocked the price below $0.100.
At around $0.08860, the immediate resistance levels sit at $0.100 and $0.120. A sustained move higher could bring the middle Bollinger Band at $0.14801 into focus. On the downside, support is located near $0.080, followed by the lower Bollinger Band around $0.066088. Together, these levels form a reference map for upcoming sessions: reclaiming the resistance zones would reflect stronger demand stepping in, while losing the support levels would point to continued selling pressure.
Bollinger Bands Point to Elevated Volatility
Following November's sharp rally and subsequent slump, the Bollinger Bands on ON's daily chart span a wide range. The upper band is positioned at $0.229941, the lower band stands near $0.066088, and the middle band sits at approximately $0.14801. Bollinger Bands measure price dispersion around a moving average, so the unusually wide spread signals that day-to-day swings have been large relative to earlier in the token's trading range.
Trading below the middle band indicates the recent price trend remains under pressure. A recovery above that level could open the way toward $0.180 and $0.200, although those zones would represent further resistance areas rather than confirmed upside targets.
The distance between the upper and lower bands also reflects elevated volatility, suggesting substantial price swings remain possible while traders assess whether ON can hold its latest recovery.
From a price perspective, a move to $0.200 would require a gain of roughly 125.72% from $0.088604. Reaching $1 would demand approximately 1,028.62% appreciation, equivalent to about 11.29 times the current price. Such a move would depend on considerably stronger buying demand, improved liquidity, and favorable conditions across the broader cryptocurrency market.
RSI Shows Bearish Momentum Despite the Recovery
ON's RSI currently stands at 35.92, below both the neutral level of 50 and its moving average of 46.87. These readings show selling momentum remains stronger than buying momentum, despite the token's latest daily gain.
During August and September, the indicator repeatedly approached oversold territory as ON broke through successive support levels. Conditions improved somewhat in October as the price stabilized around $0.100 and the RSI gradually recovered. November's initial rally then pushed the RSI above 70, reflecting strong buying momentum at the time, before the subsequent correction dragged the gauge back toward oversold territory. Readings above 70 are conventionally treated as overbought and readings below 30 as oversold, which is why the 30 line now serves as an early marker for whether selling pressure is fading or rebuilding.
The latest reading of 35.92 shows some recovery from recent lows but does not yet confirm a bullish shift (chart source: TradingView).
Holding the RSI above 30 could support further price stabilization and allow ON to test resistance near $0.100. A move below 30, however, could signal renewed selling pressure and raise the risk of a decline toward the lower Bollinger Band at $0.066088.
Orochi Network Price Predictions for 2026–2030
The following forecast, published by Hokanews, outlines projected minimum, average, and maximum prices for ON between 2026 and 2030. These figures represent potential scenarios rather than guaranteed future market prices. Long-horizon projections of this kind are best read as structured ranges: they illustrate how price could evolve under different assumptions about demand and liquidity, and the spread between each year's minimum and maximum is itself a measure of the uncertainty involved.
- 2026: The projected range is $0.060 to $0.230, with an average price of $0.110. The outlook hinges on whether ON can defend support near $0.080 and recover above $0.100. Stronger buying activity could support a move toward $0.230, while continued weakness could expose the $0.060 region.
- 2027: The forecast places ON between $0.050 and $0.350, with an average of $0.160. Stronger investor demand and increased trading activity could support the upper range, while weak liquidity or persistent selling pressure could keep the token closer to its projected minimum.
- 2028: The estimated minimum is $0.080, the average is $0.250, and the maximum is $0.550. Reaching the upper projection would depend on broader cryptocurrency market expansion and a substantial improvement in demand for ON.
- 2029: The forecast places the token between $0.120 and $0.800, with an average of $0.400. Under favorable market conditions and sustained buying demand, ON could move closer to the $1 milestone. Prolonged selling pressure or insufficient liquidity could limit its gains.
- 2030: The projected range extends from $0.180 to $1.100, with an average price of $0.650. The maximum scenario would put ON above the $1 mark, but it assumes significant improvements in market participation, liquidity, and underlying token demand.
Can Orochi Network Reach $1 by 2030?
The $1 target is mathematically possible within the forecast's most optimistic 2030 scenario, but it remains highly speculative. From the reference price of $0.088604, ON would need to appreciate roughly 1,028.62%, or about 11.29 times, to reach that level.
Before such a longer-term target becomes relevant, the token would need to clear several nearer technical hurdles. A sustained recovery above $0.100 could bring $0.120 and the $0.14801 Bollinger Band midline into focus, while losing support at $0.080 could instead expose the $0.066088 lower band.
In the sessions ahead, the indicators to watch are concrete and measurable: whether price holds above the $0.080 support, whether the RSI can recover above 30 and then its 46.87 moving average, and whether ON can reclaim the $0.14801 midline. Each threshold regained would represent an incremental improvement in market structure, while each level lost would shift attention to the next support below.
For now, ON's daily recovery offers a sign of stabilization, but its position below the Bollinger Band midline and an RSI reading below 50 indicate that bearish conditions remain influential. A move toward $1 would require sustained demand, stronger liquidity, and supportive conditions across the cryptocurrency market over the coming years.
Article by Marcus Renfield, crypto market analyst and onchain writer at Hokanews. Renfield covers cryptocurrency markets with a focus on onchain data, Bitcoin price action, and emerging market narratives, examining how capital flows, network activity, and broader market structure influence short- and medium-term trends for readers seeking a deeper understanding of crypto market dynamics.

