New Single-Family Home Inventory Jumps as Median Price Drops to Lowest Since 2021 and Sales Sag
Key Takeaways
- •The median price of new single-family homes sold in July fell to $393,800, the lowest level since September 2021.
- •Sales of new single-family homes declined 5.7% from a year earlier to 55,000, extending the year-over-year downtrend to seven months.
- •Total inventory of new single-family homes at all stages of construction rose to 495,000, the fourth straight monthly increase.
- •Inventory in the South reached 301,000 homes, close to its record level, while Midwest inventory climbed to 59,000, the highest since 2008.
- •The industry had 9.6 months of supply at the current sales rate, well above the roughly six-month level typically associated with a balanced market.
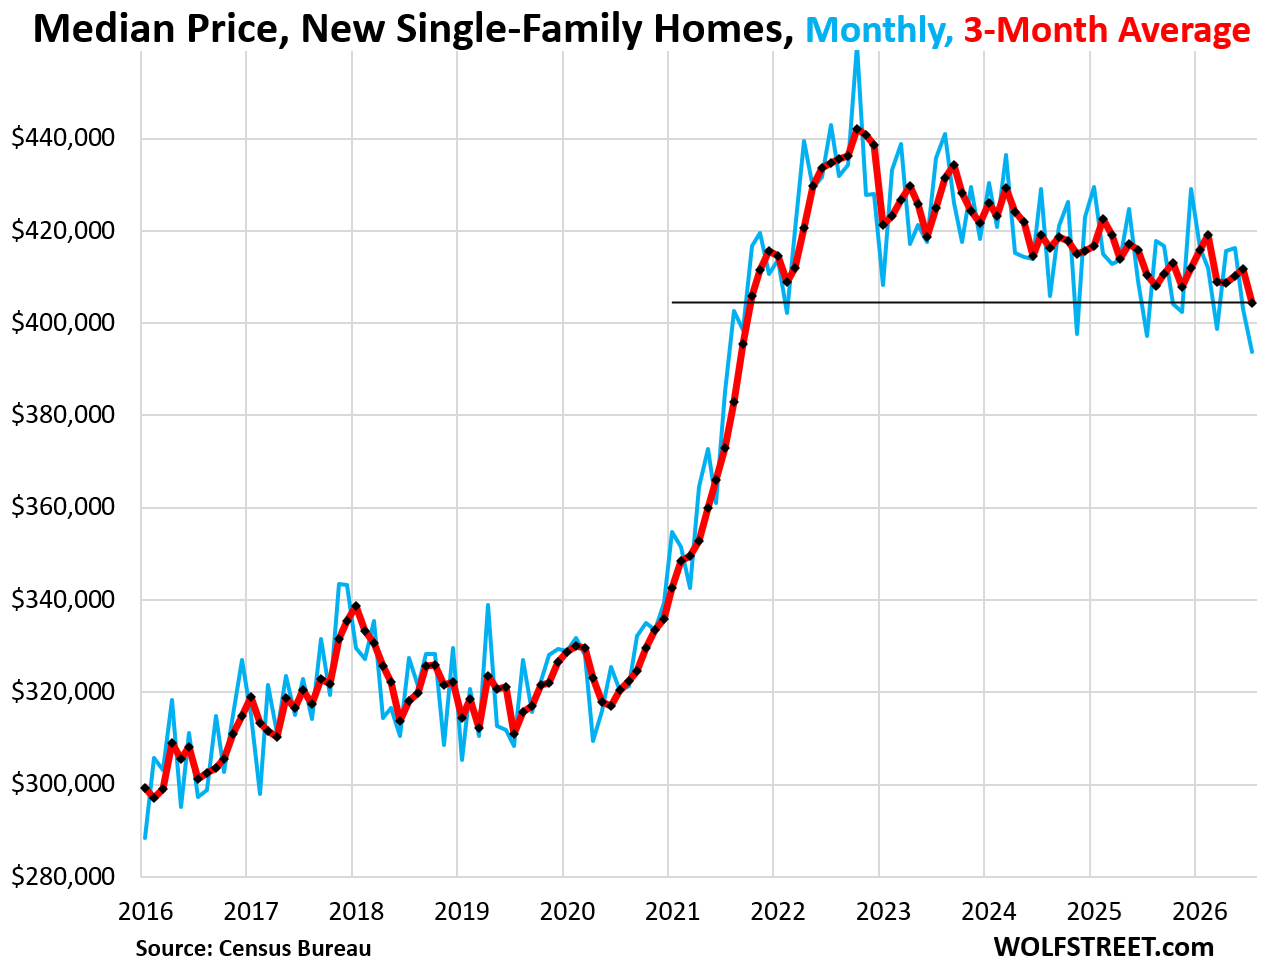
Inventory of new single-family homes for sale rose in all regions in July — approaching all-time highs in the South and spiking in the Midwest to the highest level since 2008 — while the median sale price fell to its lowest since 2021 and sales continued to sag, according to data released by the U.S. Census Bureau on August 25.
The median price of new single-family homes sold in July declined 1% from a year ago, 8.2% from two years ago, and 14% from the peak in October 2022, to $393,800 — the lowest level since September 2021. Those prices do not include the incentives and the substantial costs of the mortgage-rate buydowns that homebuilders use to prop up their sales. Homebuilders include these costs in the average selling prices they report in their financial statements, but they are not reflected in the Census Bureau data, which instead captures the prices written into sales contracts.
The three-month average median price, which irons out some of the monthly volatility, fell 1.5% year over year and 7.2% from two years ago, to $404,400 — the lowest since October 2021.
The big homebuilders — companies that have to build and sell homes to stay in business — have been adjusting to this new reality for nearly four years. To keep their revenues up and protect or gain market share, they have reduced price points, piled on incentives, and bought down mortgage rates, a combination that has substantially reduced their gross margins and crushed their net profits and share prices. Shares of DR Horton and Lennar, the two biggest builders, have plunged 25% and 52%, respectively, since mid-September 2024. The monthly NAHB/Wells Fargo Housing Market Index, which tracks the share of builders cutting prices and using incentives, offers a running gauge of that trade-off between sales volumes and margins.
Sales of new single-family homes at all stages of construction fell 5.7% year over year in July, to 55,000 homes, and were down 9% compared with July 2019. The three-month average of sales slipped 0.6% from a year ago — the seventh consecutive month of year-over-year declines. Because the Census Bureau counts a sale when the contract is signed, rather than at closing as existing-home sales are, the series is one of the timeliest reads on housing demand — and this year it has moved broadly in step with mortgage rates. Of those total sales, 63% occurred in the South and 28% in the West, a combined 91%, with the remainder in the Northeast and Midwest.
Inventory of single-family homes at all stages of construction jumped to 495,000, the fourth consecutive month of month-to-month increases. So far this year, the decline in sales and the increase in inventory have roughly tracked the rise in mortgage rates. Compared with July 2019, inventory for sale has soared 71%. Regionally, 61% of that inventory was in the South — the region that accounted for 63% of sales — and 21% was in the West, which accounted for 28% of sales.
Unlike resale inventory, which only comes onto the market when existing owners decide to sell, new-home supply can be created through construction. These new additions to the U.S. housing stock are precisely what the housing market needs most, Wolf Street argues, and homebuilders are building them — leaving the industry sitting on 9.6 months of supply at the current rate of sales, well above the roughly six months that has long served as the industry's rule of thumb for a balanced market. Build them and they will come, the publication adds — maybe, if the price is low enough and the incentives high enough.
Inventory of under-construction homes dipped to 262,000, down 10% from a year ago. The dip occurred in part because homes were completed and moved into the next category — completed homes for sale — which rose. Compared with July 2019, under-construction inventory was up 32%. Homes in this category are in the construction pipeline and offered for sale but have not yet been sold; homebuilders have a considerable amount of capital tied up in this inventory and are motivated to sell it.
Inventory of completed homes for sale rose to 114,000, after getting sold down from the very high levels recorded in December. Compared with July 2019, completed inventory was up 50%, and compared with July 2022 it has soared 170%. Builders have a lot of capital tied up in these largely move-in-ready “spec homes” and are very motivated to sell them.
Inventory and sales by region
In the South, inventory for sale rose to 301,000 new single-family homes at all stages of construction. That is down 4% from the all-time record set in July last year, but up 73% from July 2019 — a gigantic amount of inventory for homebuilders to sell. Sales in the region fell 6% year over year and were down 9% from 2019, leaving homebuilders sitting on nearly 10 months’ supply.
In the West, inventory for sale rose to 103,000 new single-family homes, down 6% from July last year and up 18% from July 2019. Sales were unchanged year over year and down 15% from 2019. Supply rose to 9.4 months at the current rate of sales.
In the Midwest, inventory for sale jumped 18% year over year and 60% from July 2019, to 59,000 new homes — the highest since 2008. Sales dropped to 4,000, a figure rounded to the nearest 1,000 by the Census Bureau, which provides for large rounding errors. On that basis, sales plunged 50% and supply soared to nearly 15 months.
In the Northeast, inventory for sale rose 3% year over year and 14% from 2019, to 33,000 new single-family homes. The Northeast is a small area with big, densely populated cities, where multifamily construction — condos and apartments — plays a big role rather than single-family construction.
Related coverage: Oh Dear, Condo Prices Fell by 15% to 33% in 33 Bigger Markets, Some Below 2006 Levels, as Historic Condo Bubbles Deflate
Source: Wolf Street
