NEAR Retreats 19% From 2026 Peak as Price Approaches Channel Support
Key Takeaways
- •NEAR traded near $4.83 on October 14, down roughly 4%, after reaching $5.18 earlier in the session and dipping to a low around $4.80.
- •The pullback came amid a broader crypto retreat that followed a higher-than-expected rise in US inflation to 3.7%, a reading that can reduce expectations for Federal Reserve rate cuts and pressure risk assets.
- •Since mid-September, NEAR has traded within an ascending channel, and the latest rally to nearly $6 reversed sharply, leaving price about 19% below its peak as it tests the rising channel floor near $4.80.
- •The 23.6% Fibonacci retracement near $4.95 is the first recovery hurdle, whereas a daily close below the channel floor would put the 38.2% retracement near $4.3, which coincides with the earlier October low, back in view.
- •The daily RSI stood near 52.8, down from overbought readings and only slightly above neutral, while Zcash fell about 4.4% and approached Fibonacci support after slipping below its 50-day moving average.
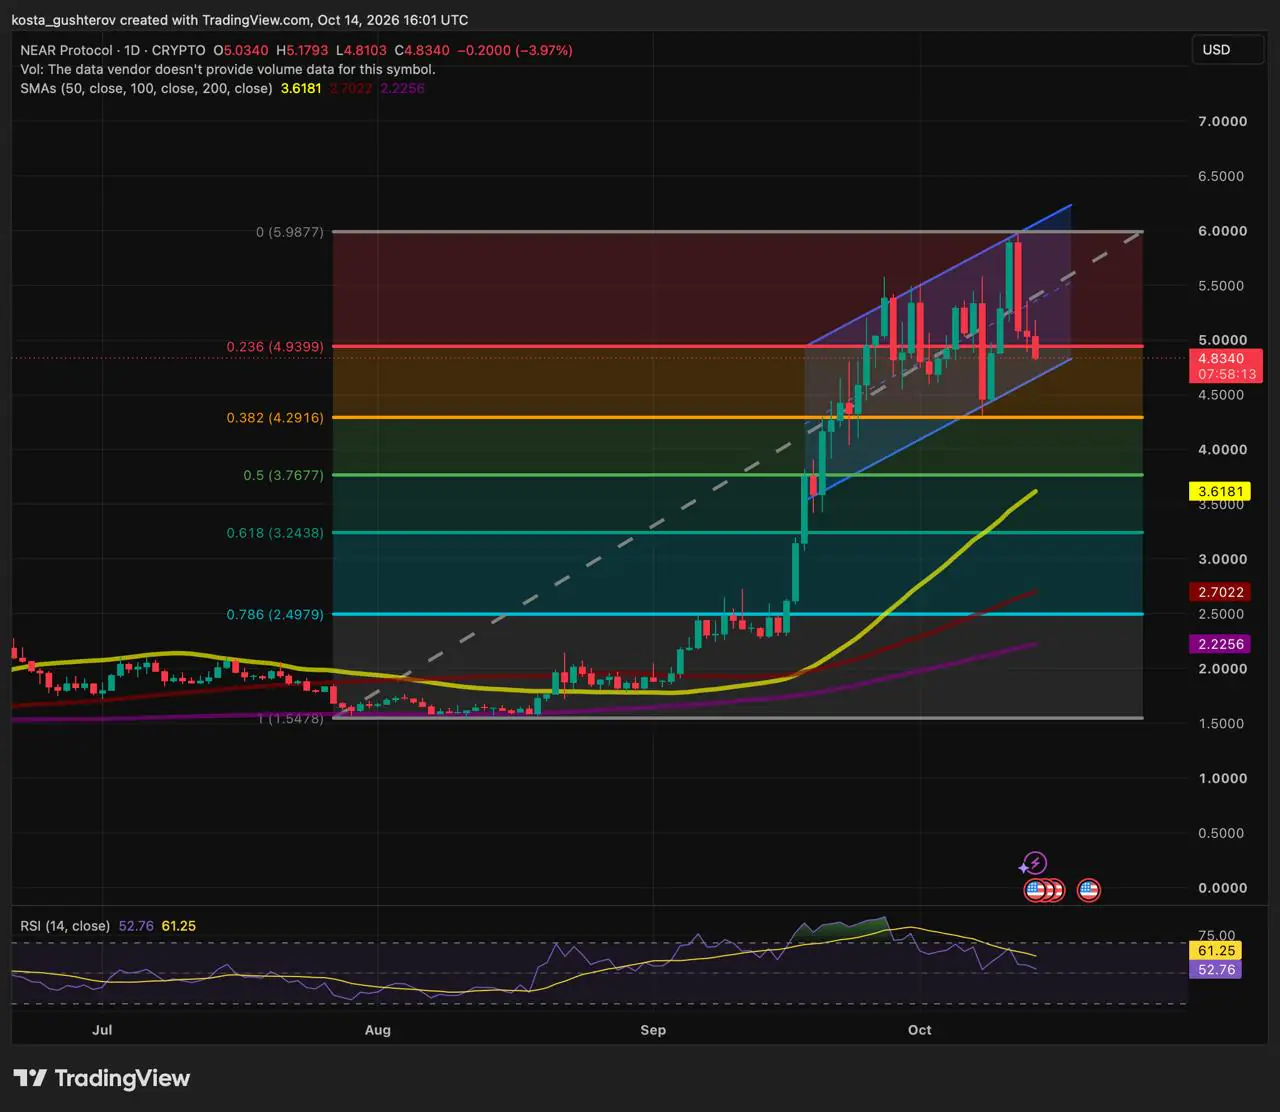
NEAR traded near $4.83 on October 14 at 16:01 UTC, down roughly 4% on its opening daily candle. The token had climbed as high as $5.18 earlier in the session before sliding to a low around $4.80, leaving the attempted recovery short-lived.
The pullback came amid a broader crypto retreat that followed a higher-than-expected rise in US inflation to 3.7%. A stronger inflation reading can reduce expectations for Federal Reserve rate cuts, potentially keeping borrowing costs elevated for longer. Higher yields can also make interest-paying assets more attractive relative to riskier investments, adding pressure to cryptocurrencies.
NEAR was not alone in testing technical support. Zcash fell about 4.4% and approached Fibonacci support after slipping below its 50-day moving average. The simultaneous declines are consistent with wider market pressure, although they do not establish inflation as the sole cause of either move.
Retreat From $6 Brings Channel Support Closer
Since mid-September, NEAR has traded within an ascending channel, with pullbacks repeatedly followed by recoveries toward higher prices. Chartists read a channel of this kind as an uptrend range: while price stays between the two rising boundaries, the structure is generally treated as an ongoing trend rather than a breakdown. The latest rally reached almost $6 near the channel's upper boundary before reversing sharply. Price is now back in the lower portion of that channel, roughly 19% below its recent peak.
The rising lower boundary runs around $4.80 on the current chart, and the latest daily candle is approaching it without a clear break beneath the line. Because the boundary slopes upward, the price required to remain inside the channel increases over time.
An earlier October sell-off bottomed at approximately $4.29 near the channel floor before NEAR rebounded toward $6. That recovery demonstrated buying interest around the lower boundary. The current decline tests whether buyers can produce another rebound, this time from a higher support area.
$4.94 Is the First Recoveryurdle
The 23.6% Fibonacci retracement sits near $4.95, measured on the advance from the $1.55 low to the $6 peak. Fibonacci retracements are a widely followed charting method that projects potential support and resistance from standard ratios of a completed move, and 23.6% is the shallowest of the commonly watched ratios. Recent daily candles have crossed this level repeatedly, and NEAR's latest decline has left it below the area once again.
Holding the channel floor would help contain the pullback, but a recovery above $4.95 would put the price back above the nearby horizontal level. Holding it through a subsequent pullback would provide stronger evidence of improvement than a brief intraday move above it.
Higher up, the rising channel midpoint forms an intermediate hurdle, roughly around $5.30–$5.50 across recent sessions. The previous peak near $6 remains the higher resistance reference. Unlike that fixed high, both the channel midpoint and the upper boundary continue to rise over time.
Momentum has weakened during the retreat. The daily relative strength index (RSI) stood near 52.8, down from overbought readings and only slightly above its neutral midpoint of 50. The RSI measures the balance of recent gains against recent losses, with readings above 70 customarily labeled overbought and 50 serving as the divide between positive and negative momentum. Momentum remains marginally positive, but the reading does not confirm that the decline has ended.
Sustained Channel Break Would Put $4.3 Back in View
A daily close below the lower boundary would weaken the ascending-channel setup. If a subsequent rebound failed to recover the channel, the next downside reference would be the 38.2% Fibonacci retracement near $4.3. That level also coincides with the earlier October sell-off low that preceded the rebound toward $6, meaning a return there would test an area where buyers recently reversed a sharp decline.
Below $4.3, the 50% Fibonacci retracement lies near $3.70. The rising 50-day simple moving average sits further down, near $3.62. These are separate references roughly $0.15 apart, with the moving average's position changing each session.
The 50-day average remains above the rising 100-day and 200-day averages, reflecting the strength of the preceding advance. The 50-, 100-, and 200-day moving averages are among the most closely watched trend references in technical analysis, and their stacked ordering is conventionally read as confirmation of an established uptrend. However, all three sit well below the current price and would offer little immediate support if the channel breaks.
With the daily candle pressing toward the rising boundary, the closes of the coming sessions are what will determine whether the channel structure holds or the deeper Fibonacci references come back into play.
This article is provided for informational purposes only and does not constitute financial or investment advice. Technical levels and indicators are interpretive tools, not guarantees of future price movement.

