NEAR Price Squeezed Into a 29-Cent Range by Three Key Levels
Key Takeaways
- •NEAR slipped 1.59% to $3.34 on Binance, squeezed within a 29-cent band formed by the 0.618 Fibonacci retracement near $3.23, the descending channel line, and the 100-day SMA at $3.52.
- •The token rallied from roughly $1.52 in August to nearly $5.99 by mid-October, and the subsequent slide has erased about 44% of that peak.
- •Since late October, price has descended within a parallel channel, with moderate volume indicating organized, steady selling rather than panic-driven capitulation.
- •The 50-day SMA near $4.42 has rolled over, but the 200-day SMA at $2.72 is still rising and no bearish moving-average crossovers have occurred.
- •The 14-day RSI reads 39.65, below the midline yet above oversold territory and hooking higher; a run of daily closes above the channel would signal a breakout, while losing $3.23 would put the rising 200-day SMA at $2.72 in play.
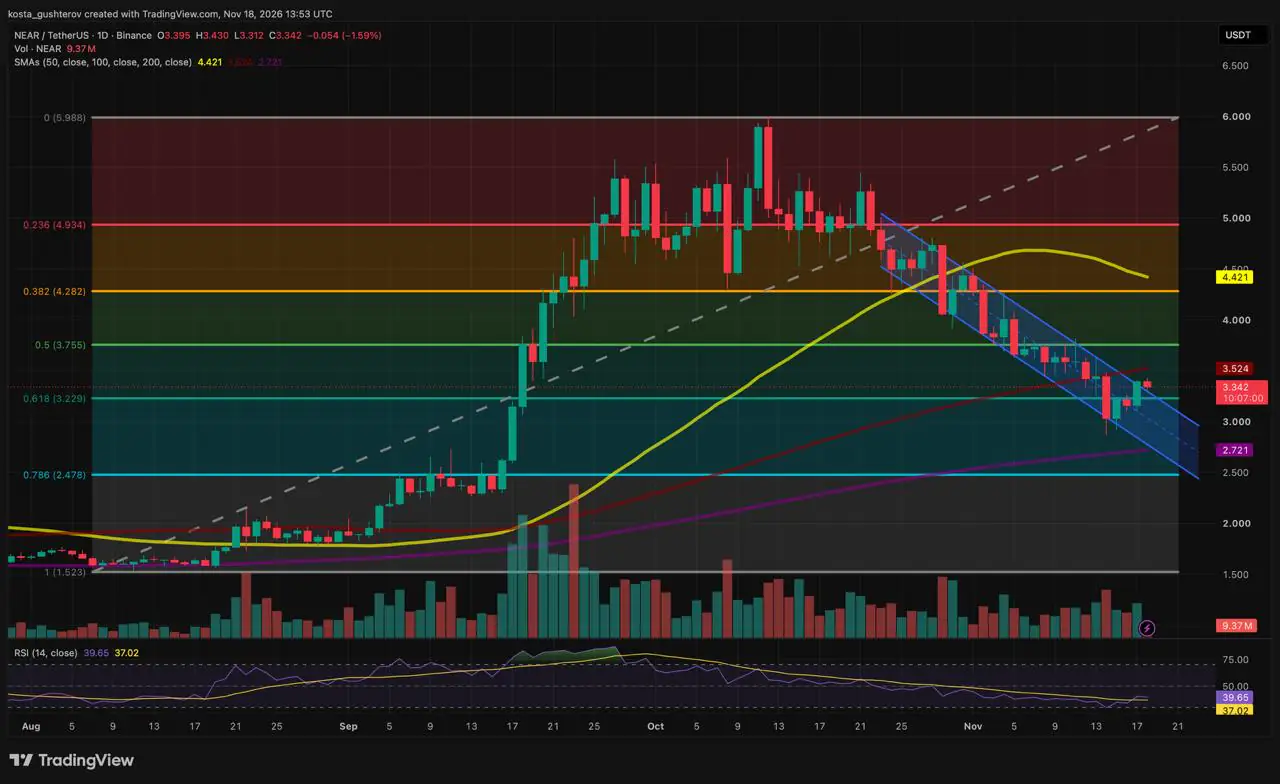
NEAR is trading at $3.34 on the daily NEAR/USDT chart on Binance, down 1.59% on the day after opening at $3.40 and moving between an intraday low of $3.31 and a high of $3.43. That narrow tape captures the broader setup: the token is wedged into a 29-cent band, with Fibonacci support underneath, a key moving average overhead, and a descending channel line cutting directly through recent candles.
Where the Levels Come From
Every significant reference point traces back to a single move. NEAR bottomed near $1.52 in August and rallied to a high close to $5.99 by mid-October, nearly quadrupling in about two months. The slide since has cut roughly 44% off that peak, yet at $3.34 the token still changes hands at more than twice its August low.
Projecting a Fibonacci grid across that rally fills in the map. The 0.236 retracement sits near $4.93, the 0.382 around $4.28 and the 0.5 near $3.76. Lower down, the 0.618 lands close to $3.23, with the 0.786 around $2.48.
The top itself took weeks to form. Through late September and most of October, NEAR chopped between the 0.382 area and levels above the 0.236, tagging its high near $6 along the way — a grind rather than a spike and a crash.
A Channel of Lower Highs
The selling then became more organized. From late October, price slid inside a descending parallel channel, with each bounce peaking below the previous one and each low undercutting the one before it.
Volume never signaled panic. The decline within the channel came without a capitulation-sized spike, and today's 9.37 million NEAR in volume is moderate. The pattern reflects steady selling rather than a forced flush.
Mid-November delivered the real stress test. NEAR slipped below the 0.618 retracement, then climbed back above it within days. Traders monitor that line closely: it is the deepest standard retracement that still reads as a pullback within a larger advance, and beyond it only the 0.786 remains between price and the loss of most of the rally.
Three Levels Inside 29 Cents
The bounce off the 0.618 ran straight into the channel's upper boundary. The last two sessions have settled on that line or just above it, and today's small red candle shows sellers defending it.
Immediately overhead sits the 100-day simple moving average at $3.52, the first ceiling for any rebound. The resulting squeeze is tight: the 0.618 sits below, the 100-day SMA above, and the channel line cuts right through the current candles — all within a $0.29 range. In percentage terms, that band spans roughly 9% of the token's price, with the SMA ceiling about 5% above the current level and the Fibonacci floor about 3% below it.
A single session poking above a trendline does not constitute a breakout. A run of daily closes clearly outside the channel would. Closes above the 100-day SMA would make that case considerably harder to dispute.
Bent Trend, Not a Broken One
The 50-day SMA carries the bearish half of the story. At about $4.42, more than 30% above the current price, it has rolled over and now slopes downward — the clearest evidence that the medium-term trend has turned against buyers.
Lower in the structure, the picture changes. The 200-day SMA at $2.72 is still rising — and that line, one of the most widely followed gauges of long-term trend in technical analysis, sits roughly 19% below the current price. The moving averages have not crossed: the 50 remains above the 100, which in turn remains above the 200. A bearish crossover would require a shorter average dropping beneath a longer one, and none has occurred. The structure built during the rally is dented, not dismantled.
Momentum readings support that interpretation. The 14-day RSI prints 39.65, below the 50 midline, leaving sellers with the edge for now. The indicator has, however, hooked higher and sits above its own moving average at 37.02, and it stayed above the oversold threshold at 30 throughout the entire decline.
Beyond Each Edge of the Band
Either side of the range can give way first, and the chart outlines both paths.
Break above $3.52. A daily close over the 100-day SMA, with price outside the channel, would bring the 0.5 retracement near $3.76 into view. Beyond that, the 0.382 around $4.28 and the falling 50-day SMA at $4.42 stack into a thicker resistance zone.
Slip below $3.23. If sellers reject the channel top and price loses the 0.618 near $3.23, the rising 200-day SMA at $2.72 is the first level in the way, with the 0.786 around $2.48 beneath it.
Neither path is a forecast. As long as NEAR holds the 0.618 and the 200-day SMA keeps climbing, the drop from $5.99 still reads as a deep correction of the $1.52 rally. A sustained move below both would recast it as a broken trend.
The first signal will not be dramatic. It would be a run of daily closes clearly above the channel line — not a single candle. If those closes arrive with the RSI back above 50, buyers would hold the momentum edge as well as the structural one. Until then, the channel still sets the terms.
This article originally appeared on Coindoo.

